
June 2025
Provided by Prairie Research Associates

Background and Objectives
Background
- Historically, this study has been used as a tool for measuring the level of satisfaction of the citizens of Winnipeg.
- The City of Winnipeg has conducted this study annually since 2001 (three years missed – 2005, 2006, and 2008).
Objectives
- Determine Winnipeg citizen’s levels of satisfaction regarding their city
- Determine Winnipeg citizen’s current needs in their city
- Gauge how those needs have changed and where they are heading
e.g. Are specific issues trending downward or emerging?
- Gauge how those needs have changed and where they are heading
Methodology
A total of 600 Winnipeg residents aged 18 years and over were surveyed using PRA Inc.’s online panel, The Manitoba Research Collective between May 7 to May 18, 2025. The final results in this survey are weighted, unless specified by age, gender, and income of Winnipeg respondents according to 2021 Statistics Canada census data.
Because this sample is a non-probability sample, no error rate can be calculated. A random population survey of this size would yield an error rate of ± 4.0% (19 times out of 20). The margin-of-error is higher for sub-populations analyzed in these results.
Where applicable, this report compares the results of the 2025 survey with the results of previous resident satisfaction surveys conducted in 2021 to 2024.
Notes:
- Data presented is based on people who answered the survey questions (excludes “don’t know/refused” response).
- The percentages shown in this report may not add up to exactly 100%, due to rounding.
- Values 4% or less may not be shown in charts.
- Statistical differences identified in this report have a p-value of less than .001. Key differences between groups that are noted in blue represent those groups with the highest proportions to the question while those in red represent the lowest.
Demographics
The majority of respondents are under 55 years old and 73% are homeowners.
Age
Question 73 -- Which of the following age groups are you in? (Base: All respondents (excluding Refused). 2025 n=600) - unweighted
| Age | Percent |
|---|---|
| 65 and older | 23% |
| 55 to 64 | 10% |
| 45 to 54 | 22% |
| 35 to 44 | 16% |
| 25 to 34 | 18% |
| 18 to 24 | 12% |
Own/Rent Home
Question 74 -- Do you rent or own your home? (Base: All respondents (excluding Don’t know/Refused). 2025 n=586) - unweighted
| Own or Rent | Percent |
|---|---|
| Rent | 27% |
| Own | 73% |
Level of Education
The majority of respondents have some post-secondary education with 49% having a university degree. Of the 69% of residents who answered the income question, about 2 in 3 have a household income of $60,000 or more.
Question 75 -- What is the highest level of education you have completed? (Base: All respondents (excluding Don’t know/Refused). 2025n=599) - unweighted
| Level of Education | Percent |
|---|---|
| University degree(s) | 56% |
| Community college/technical | 26% |
| Completed high school | 17% |
| Less than high school | 1% |
Household Income
Question 76 -- Total household income before taxes. (Base: All respondents (excluding Don’t know/Refused). 2025 n=556) - unweighted
| Income | Percent |
|---|---|
| $150K+ | 24% |
| $100K to $150k | 22% |
| $80K to <$100K | 14% |
| $60K to <$80K | 14% |
| $30K to <$60K | 17% |
| <$30K | 9% |
Where do they live?
Question 78 -- First three characters of postal code. (Base: All respondents (excluding Don’t know/Refused). 2025 n=600) – unweighted
| Quadrant | Percent |
|---|---|
| Downtown | 14% |
| West/Southwest | 39% |
| North | 10% |
| East/Southeast | 38% |
| Inner or outer city | Percent |
|---|---|
| Inner City | 29% |
| Outer City | 71% |
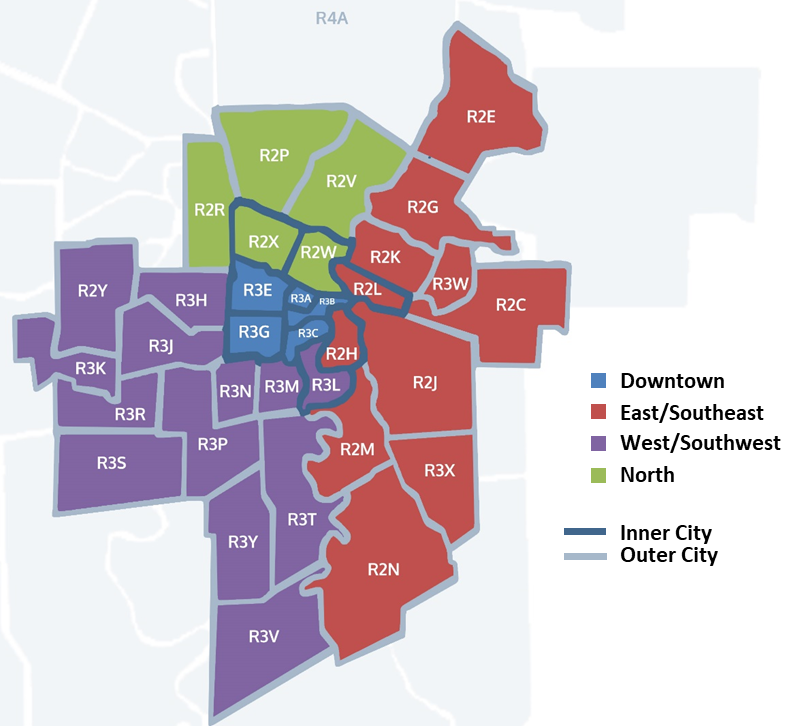
Map of Winnipeg divided by postal code areas using colours to show four quadrants: Downtown, East/Southeast, West/Southwest, and North. The map also has a dark blue line around inner city postal code areas (R2X, R2W, R3E, R3A, R3B, R3C, R3G, R2L, R2H, and R3L) and a light blue line around the other postal code areas to show the outer city.
How do they identify?
About one in three report identifying as visible minority, person with a disability, a part of the 2SLGBTQIA+ community or as an Indigenous person.
Question 77 -- Do you identify as any of the following? Multiple responses allowed (Base: All respondents (excluding Don’t know/Refused). 2025 n=591) -- unweighted
| Identify | Percent |
|---|---|
| Visible minority | 12% |
| Person with a disability | 11% |
| 2SLGTQIA+ | 9% |
| Indigenous person (First nation, Metis and Inuit) | 7% |
| None | 66% |
Results
2025 Overall Satisfaction
Quality of Life (Very good/Good)
| Year | Percent |
|---|---|
| 2021 | 89% |
| 2022 | 88% |
| 2023 | 84% |
| 2024 | 82% |
| 2025 | 86% |
Value for Tax Dollars (Very good/Good)
| Year | Percent |
|---|---|
| 2021 | 64% |
| 2022 | 59% |
| 2023 | 59% |
| 2024 | 55% |
| 2025 | 57% |
Customer Service (Very /Somewhat Satisfied)
| Year | Percent |
|---|---|
| 2021 | 78% |
| 2022 | 73% |
| 2023 | 72% |
| 2024 | 78% |
| 2025 | 75% |
Overall City Services (Very /Somewhat Satisfied)
| Year | Percent |
|---|---|
| 2021 | 87% |
| 2022 | 81% |
| 2023 | 80% |
| 2024 | 76% |
| 2025 | 72% |
Net Promoter Score Value
27% are classified as Winnipeg promoters, and the overall 2025 NPS is -8. This is an 8-point increase compared to 2024. Following three years of a consistent trend where detractors exceeded promoters, recent data indicates a tightening gap between the two groups.
NET Promoter Score (NPS) is calculated by subtracting the Detractor score from the Promoter score (% Promoters - % Detractors)
Likelihood of Recommending Winnipeg as a Place to Live
Question 2 -- On a scale from 0 to 10, where 0 is not at all likely and 10 is very likely, how likely would you be to recommend Winnipeg as a place to live? (Base: All respondents (excluding Don’t know/Refused). 2025 n=597)
Note
- Older Winnipeggers are twice as likely to be promoters than younger Winnipeggers.
| Year | Net Promoter Score | Promoters (9-10 out of 10) | Passives (7-8 out of 10) | Detractors (0-6 out of 10) |
|---|---|---|---|---|
| 2021 | +1 | 27% | 47% | 26% |
| 2022 | -14 | 21% | 45% | 35% |
| 2023 | -15 | 21% | 43% | 36% |
| 2024 | -16 | 21% | 42% | 37% |
| 2025 | -8 | 27% | 39% | 35% |
Quality of Life
After three consecutive years of decline in the proportion of Winnipeggers rating the overall quality of life as very good or good from 2021 to 2024, 2025 marks a positive shift. This year, 86% of residents rate their quality of life positively, with 23% describing it as very good, an increase from previous years.
Overall quality of life in Winnipeg today
Question 3 -- In general, how would you consider the overall quality of life in Winnipeg today? (Base: All respondents (excluding Don’t know/Refused). 2025 n=596)
Note
- Older Winnipeggers (94%) are more likely to rate quality of life as very good or good.
| Year | Net very Good/Good | Very good | Good | Poor | Very poor |
|---|---|---|---|---|---|
| 2021 | 89% | 23% | 66% | 9% | 1% |
| 2022 | 89% | 20% | 69% | 10% | 3% |
| 2023 | 84% | 18% | 66% | 14% | 2% |
| 2024 | 82% | 15% | 67% | 14% | 2% |
| 2025 | 86% | 23% | 63% | 13% | 2% |
Quality of Life Statements
Question 4 to Question 9 -- I am now going to read you a few statements about your perception of Winnipeg. For each one, please tell me whether you strongly agree, agree, disagree, or strongly disagree. (Base: All respondents (excluding Don’t know/Refused). 2025 n=476-591)
Easy to get around by car
| Year | Percent who responded Strongly agree/Agree |
|---|---|
| 2021 | 91% |
| 2022 | 88% |
| 2023 | 89% |
| 2024 | 88% |
| 2025 | 90% |
Easy to get around by walking
| Year | Percent who responded Strongly agree/Agree |
|---|---|
| 2021 | 77% |
| 2022 | 72% |
| 2023 | 67% |
| 2024 | 70% |
| 2025 | 59% |
Note
- In 2025, 74% of those 55 years or older, and 38% of those who identified as a visible minority felt it is easy to get around by walking.
Feel safe walking alone at night in neighbourhood
| Year | Percent who responded Strongly agree/Agree |
|---|---|
| 2021 | 66% |
| 2022 | 66% |
| 2023 | 60% |
| 2024 | 62% |
| 2025 | 58% |
Note
- In 2025, 64% of those who own their home felt safe walking alone at night in their neighbourhood.
Easy to get around by bicycle
| Year | Percent who responded Strongly agree/Agree |
|---|---|
| 2021 | 66% |
| 2022 | 63% |
| 2023 | 58% |
| 2024 | 61% |
| 2025 | 51% |
Note
- In 2025, 63% of those who those who identified as 55+ years old felt it was easy to get around by bicycle.
Easy to get around by transit
| Year | Percent who responded Strongly agree/Agree |
|---|---|
| 2021 | 62% |
| 2022 | 61% |
| 2023 | 56% |
| 2024 | 52% |
| 2025 | 48% |
Feel safe walking alone at night downtown
| Year | Percent who responded Strongly agree/Agree |
|---|---|
| 2021 | 14% |
| 2022 | 14% |
| 2023 | 10% |
| 2024 | 8% |
| 2025 | 12% |
Downtown visitation and safety
Three in five Winnipeggers at least visited downtown monthly within the last 12 months.
Younger Winnipeggers are most likely to frequent downtown at least monthly. Those with less than high school education are less likely to visit monthly. Households with income less than $30,000 are most likely to visit at least weekly.
The more frequent a visitor the more likely they are to feel safe at night walking downtown.
Men are more likely than women to feel safe walking downtown alone at night.
Question 64B -- How often have you visited downtown in the past 12 months? (Base: All respondents (excluding Don’t know/Refused). 2025 n=595) (First asked in 2025)
| Frequency visiting downtown | 2025 |
|---|---|
| At least weekly | 36% |
| At least monthly | 24% |
| A few times a year | 24% |
| Once or twice a year | 10% |
| Not in the past 12 months | 6% |
Feel safe walking downtown alone at night
| 2025 | Percent who responded Strongly/Somewhat agree | Percent who responded Strongly/Somewhat disagree |
|---|---|---|
| At least weekly | 17% | 83% |
| At least monthly | 13% | 87% |
| A few times a year | 8% | 92% |
| Once a year or less often | 1% | 99% |
Perceptions of Winnipeg Statements
Question 10 to Question 12 -- I am now going to read you a few statements about your perception of Winnipeg. For each one, please tell me whether you strongly agree, agree, disagree, or strongly disagree. (Base: All respondents (excluding Don’t know/Refused). 2025 n=488-576)
I can find the information I need on the City of Winnipeg website
| Year | Percent who responded Strongly agree/Agree |
|---|---|
| 2021 | 85% |
| 2022 | 82% |
| 2023 | 79% |
| 2024 | 81% |
| 2025 | 83% |
I believe the City of Winnipeg acts in the best interest of citizens
| Year | Percent who responded Strongly agree/Agree |
|---|---|
| 2021 | 71% |
| 2022 | 66% |
| 2023 | 61% |
| 2024 | 68% |
| 2025 | 63% |
Note
- There are no demographic subgroups more likely to strongly or somewhat agree with these perceptions.
I find the City of Winnipeg to be a trustworthy source of information
| Year | Percent who responded Strongly agree/Agree |
|---|---|
| 2021 | 87% |
| 2022 | 83% |
| 2023 | 83% |
| 2024 | 81% |
| 2025 | 80% |
Question 12A to Question 12C -- I am now going to read you a few statements about your perception of Winnipeg. For each one, please tell me whether you strongly agree, agree, disagree, or strongly disagree. (Base: All respondents (excluding Don’t know/Refused). 2024 n=520-563)
I believe the City of Winnipeg's actions towards reconciliation with Indigenous peoples are making a positive impact
| Year | Percent who responded Strongly agree/Agree |
|---|---|
| 2021 | 70% |
| 2022 | 71% |
| 2023 | 68% |
| 2024 | 65% |
| 2025 | 84% |
I believe the City of Winnipeg is doing enough for residents who are experiencing homelessness.
| Year | Percent who responded Strongly agree/Agree |
|---|---|
| 2022 | 24% |
| 2023 | 25% |
| 2024 | 27% |
| 2025 | 24% |
Note
- There are no demographic subgroups more likely to strongly or somewhat agree with these perceptions.
Actions to Improve Quality of Life
Winnipeggers most commonly mentioned crime and policing for improving the quality of life in Winnipeg, followed by housing and social programming. In 2025, fewer residents mentioned roads and infrastructure than in the previous year.
Question 13 -- What actions do you think the City of Winnipeg could take to improve the quality of life in the City? (accept up to 3 answers) (Base: All respondents (excluding Don’t know/Refused). 2025 n=536)
| Action to improve quality of life | 2025 | 2024 | 2023 | 2022 | 2021 |
|---|---|---|---|---|---|
| Crime / Policing | 44% | 36% | 33% | 14% | 23% |
| Housing / Social programs | 36% | 31% | 30% | 23% | 24% |
| Roads / Infrastructure | 29% | 39% | 36% | 58% | 23% |
| Active living / Transit | 23% | 15% | 17% | 17% | 20% |
| Improve services | 21% | 18% | 19% | 23% | 22% |
| Economy | 14% | 8% | 12% | 11% | 8% |
| City Planning | 13% | 11% | 11% | 8% | 10% |
| All Others | 11% | 15% | 18% | 18% | 22% |
| Nothing | 1% | <1% | <1% | 1% | 2% |
Top Actions by perceived Quality of Life
| Action | Very good/Good (87%, n=462) | Very Poor/Poor (14%, n=72) |
|---|---|---|
| Crime / Policing | 42% | 59% |
| Housing/social programs | 37% | 29% |
| Roads / Infrastructure | 28% | 30% |
| Active living / Transit | 23% | 23% |
| Improve services | 21% | 20% |
| Economy | 13% | 21% |
| City Planning | 12% | 20% |
Most common actions for Good/Very good (87%, n=462)
- Reduce crime (28%)
- Address homelessness (25%)
- Fix roads and streets (22%)
- Improve public transit (15%)
- Develop affordable housing (10%)
Most common actions for Very poor/Poor (14%, n=72)
- Reduce crime (37%)
- Fix road and streets (26%)
- Address homelessness (17%)
- Improve public transit (13%)
- Develop affordable housing (12%)
Selected verbatims for Good/Very good (87%)
- “Reducing crime with more police, especially downtown. Allocating more of the budget toward maintenance of roads.”
- “More housing for low-income individuals. Help, support and services for people who use drugs, such as harm reduction services and safe housing.”
- “Fix potholes faster, and don’t let construction last years like on Abinojii Mikanah.”
- “Improve the reliability, frequency, and coverage of public transit.”
- “The homelessness and violence downtown needs to be improved. We need stricter enforcement with these individuals and remove them from areas.”
- “Repair the roads. Work harder on fighting crime.”
Selected verbatims for Very poor/Poor (14%)
- “Safety is major issue. Roads are terrible.”
- “I would like to see investments in city cleanliness and infrastructure, including public transit accessibility. I would also like to see increased support for the unhoused. Regardless of why people are unhoused, there simply isn't enough shelter space or support to improve their conditions.”
- “Decrease the cost of living, improved access to housing (especially pet-friendly housing options), decrease crime and improve public safety, finish infrastructure upgrades in a timely manner.”
- “I want to get improvement on transits and safety.”
- “Build good quality roads, decrease crime activity.”
Value for Tax Dollars
Over half of Winnipeggers feel that they receive good or very good value for their property tax dollars. Results are similar to 2024.
Question 14 -- Considering the services provided by the City for your property tax dollars, do you feel you receive… (Base: All respondents (excluding Don’t know/Refused). 2025 n=519)
Perceived value from property tax dollars
| Year | Percent who answered Very good/ Good value | Very good value | Good value | Poor value | Very poor value |
|---|---|---|---|---|---|
| 2021 | 64% | 7% | 58% | 28% | 8% |
| 2022 | 59% | 4% | 55% | 33% | 8% |
| 2023 | 59% | 4% | 55% | 31% | 10% |
| 2024 | 55% | 3% | 52% | 36% | 9% |
| 2025 | 57% | 5% | 52% | 35% | 8% |
Note
- Older Winnipeggers (67%) are more likely to rate value for tax dollars as very good or good while those who identify as Indigenous (29%) are least likely.
Question 14B -- Why do you feel you receive good/poor value* from your property tax dollars? Multiple response allowed. (Base: Gave an opinion about value for taxes (excluding Don’t know/Refused). 2025 n=412)
*Question text responsive to respondent's previous answer.
Reasons for Value Received for Tax Dollars
| Reason | Very good/good value (55%, n=222) | Very poor/poor value (45%, n191) |
|---|---|---|
| City Planning/Spending | 60% | 48% |
| Roads/Infrastructure | 17% | 49% |
| Services | 40% | 28% |
| Safety/Policing | 8% | 19% |
| Other | 8% | 14% |
Most common reasons for very good/good value (54%, n=222)
- General satisfaction with the City (28%)
- Room for improvement (19%)
- Satisfaction with snow clearing (17%)
- Satisfaction with garbage/recycling (14%)
Most common reasons for very poor/poor value (46%, n=191)
- Dissatisfaction with roads (40%)
- Dissatisfaction with the City’s spending (31%)
- High taxes (15%)
- Dissatisfaction with City administration (15%)
- Unsafe community/crime (14%)
Selected verbatims for very good/good value (54%)
- “Things like garbage collection and snow clearing are mostly done in a timely and efficient manner.”
- “The services provided by the city meet my needs in a timely manner. Snow is cleared quickly, garbage and recycling are picked up more frequently than I need, and the water/sewage pipes are properly maintained.”
- “Services are executed reasonably well, such as garbage collection, snow removal and street cleaning.”
- “Love my library. The new bus routes also look like they're finally doing something good with transit in the city.”
- “My street gets plowed in the winter. The police patrol my neighbourhood regularly. I know that I have firemen & paramedics not far away if I need them.”
- “City services are essential. They are covering the basics well but could do better.”
- “The city provides services to keep me comfortable and safe.”
Selected verbatims for very poor/poor value (46%)
- “The roads are terrible; property crime is terrible. There is no effort being made for homeless people. What are my very high property taxes going to?”
- “Winnipeg feels behind. Roads are always in terrible condition. The transit system is awful. We don't have more innovative programs and services like city-wide composting.”
- “Taxing homeowners is not going to fix the the deficit issue that we have that leaves us unable to address serious infrastructure issues across the city. Tax vacant business buildings. Require commercial building owners to pay taxes on vacant spaces.”
- “I am not seeing results in anything worthwhile. It seems the people in charge keep making decisions that benefit their friends in other departments.
- “Roads are falling apart. Crime is increasing.”
- “The police budget is outrageous.”
Customer Service
Contact with the City
Slightly over half of Winnipeggers contacted the city in the past year, with those under 35 to be least likely to do so. Phone is the most common method used to contact the City, although email and completing an online form have continued to grow over the past five years.
Question 65 -- Have you contacted 311 or another staff member from the City of Winnipeg in the last year? (Base: All respondents (excluding Don’t know/Refused). 2025 n=583))
Contact with the City in the last year
| Year | Percent who responded Strongly agree/Agree |
|---|---|
| 2021 | 55% |
| 2022 | 58% |
| 2023 | 60% |
| 2024 | 54% |
| 2025 | 55% |
Note
- In 2025, 42% of those who were 18 to 34 years old had contacted the City in the last year.
How did you contact the City?
Question 66 -- How did you contact the City of Winnipeg? Multiple responses allowed (Base: Contacted the city (excluding Don’t know/Refused). 2025 n=316)
| Year | Percentage who contacted the City by phone |
|---|---|
| 2021 | 85% |
| 2022 | 82% |
| 2023 | 84% |
| 2024 | 83% |
| 2025 | 80% |
| Year | Percentage who contacted the City by email |
|---|---|
| 2021 | 17% |
| 2022 | 18% |
| 2023 | 22% |
| 2024 | 21% |
| 2025 | 34% |
| Year | Percentage who contacted the City by completing the form online |
|---|---|
| 2021 | 7% |
| 2022 | 12% |
| 2023 | 15% |
| 2024 | 16% |
| 2025 | 33% |
| Year | Percentage who contacted the City in person |
|---|---|
| 2021 | 2% |
| 2022 | 4% |
| 2023 | 3% |
| 2024 | 4% |
| 2025 | 6% |
| Year | Percentage who contacted the City through social media |
|---|---|
| 2021 | 4% |
| 2022 | 3% |
| 2023 | 3% |
| 2024 | 2% |
| 2025 | 3% |
| Year | Percentage who contacted the City by mail |
|---|---|
| 2021 | 1% |
| 2022 | 1% |
| 2023 | 2% |
| 2024 | 4% |
| 2025 | 2% |
Satisfaction with Customer Service
Satisfaction with customer service dropped by three points from last year. Satisfaction with customer service is virtually the same across the three most used methods to contact the City.
Question 67 -- How would you rate the experience? (Base: Contacted the city (excluding Don’t know/Refused). 2025 n=314)
| Year | Percent who answered Very/somewhat satisfied | Very satisfied | Somewhat satisfied | Somewhat dissatisfied | Very dissatisfied |
|---|---|---|---|---|---|
| 2021 | 78% | 44% | 34% | 13% | 9% |
| 2022 | 73% | 35% | 38% | 15% | 12% |
| 2023 | 72% | 33% | 39% | 11% | 17% |
| 2024 | 78% | 40% | 39% | 10% | 12% |
| 2025 | 75% | 28% | 48% | 18% | 6% |
Note
- There are no demographic subgroups more likely to be satisfied with the customer service experience.
| Method of contact | Percentage of Very/ Somewhat satisfied |
|---|---|
| Phone | 74% |
| 72% | |
| Online | 73% |
Customer Service Details
Question 68 to Question 71 -- I am going to read you a number of statements about the City. Thinking about your personal dealings with the City of Winnipeg and your general impressions, please tell me whether you strongly agree, somewhat agree, somewhat disagree, or strongly disagree. (Base: Contacted the city (excluding Don’t know/Refused). 2025 n=287-302)
| City staff are courteous, helpful and knowledgeable | Percent who responded Strongly/somewhat agree |
|---|---|
| 2021 | 92% |
| 2022 | 90% |
| 2023 | 87% |
| 2024 | 87% |
| 2025 | 89% |
| The quality of service from the City is consistently high | Percent who responded Strongly/somewhat agree |
|---|---|
| 2021 | 76% |
| 2022 | 66% |
| 2023 | 66% |
| 2024 | 68% |
| 2025 | 73% |
| City staff are easy to get a hold of when I need them | Percent who responded Strongly/somewhat agree |
|---|---|
| 2021 | 61% |
| 2022 | 49% |
| 2023 | 52% |
| 2024 | 50% |
| 2025 | 53% |
| The City responds quickly to requests and concerns | Percent who responded Strongly/somewhat agree |
|---|---|
| 2021 | 67% |
| 2022 | 51% |
| 2023 | 53% |
| 2024 | 54% |
| 2025 | 50% |
Note
There are no demographic subgroups more likely strongly or somewhat agree with these customer service details.
Improvement to Customer Service
Question 72 -- How could the City's customer service be improved? Multiple responses allowed (Base: Contacted customer service (excluding Don’t know/Refused). 2024 n=298)
Customers service improvements by satisfaction level
| Suggested Improvement | Very/Somewhat satisfied (75%, n=184) | Very/Somewhat dissatisfied (25%, n=61) |
|---|---|---|
| Staff contact | 28% | 54% |
| Staffing Levels/Availability | 17% | 31% |
| Systems | 11% | 14% |
| Other | 6% | 9% |
| No suggestions/satisfied | 45% | 16% |
Most common improvements for Very/Somewhat satisfied (75%, n=184)
- No suggestions/satisfied (45%)
- Staff should respond to issues more quickly (13%)
- Answer phone more quickly/less time on hold (11%)
- Follow up on reported issues/follow through (7%)
Most common improvements for Very/Somewhat dissatisfied (25%, n=61)
- Follow up on reported issues/follow through (24%)
- Staff should be more knowledgeable (18%)
- Answer phone more quickly/less time on hold (17%)
- No suggestions/satisfied (16%)
Selected verbatims for Very/Somewhat satisfied (75%)
- “Clarity in addressing issues, following up with the person in need, offering a variety of useful suggestions and advice.”
- “Faster response times.”
- “Improved wait times and faster responses.”
- “The way they pass along forms and concerns is awful. Tracking a request online is ridiculous. They close the ticket and don't let you know why, and the issue has not been resolved.
- “More staff on the phone, it takes a while to connect to a real person. The waiting times need to improve.”
- “Ticket system, call back features.”
Selected verbatims for Very/Somewhat dissatisfied (25%)
- “More knowledgeable and easier to reach/more staff.”
- “Start by being available and get back to individuals with results.”
- “More employees to help the backlog.”
- “Wait times to speak with a person need to be shorter.”
- “Make sure they are properly trained to be able to answer any question with regards to Winnipeg Civic Services.”
- “Follow-up to 311 calls need improvement.”
- “311 agents generally good but sometimes give inaccurate information.”
City Services
Overall Satisfaction with City Services
72% of Winnipeggers are at least somewhat satisfied with city services, which dropped for the fourth consecutive survey.
Question 52 -- In general, how satisfied are you overall with the services provided by the City of Winnipeg? (Base: All respondents (excluding Don’t know/Refused). 2025 n=592)
| Year | Net very/ somewhat satisfied | Very satisfied | Somewhat satisfied | Somewhat dissatisfied | Very dissatisfied |
|---|---|---|---|---|---|
| 2021 | 90% | 23% | 64% | 10% | 3% |
| 2022 | 87% | 13% | 68% | 16% | 3% |
| 2023 | 80% | 12% | 68% | 16% | 4% |
| 2024 | 76% | 11% | 64% | 20% | 4% |
| 2025 | 72% | 10% | 62% | 23% | 5% |
Note
- As age of Winnipeggers increase, the likelihood that they are to be very or somewhat satisfied overall with city services also increases (62% to 80%).
Satisfaction with Public Works
Question 15/Question 21/Question 22/Question 23/Question 27/Question 36/Question 41/Question 42 -- Now, I'm going to read you a list of services that are provided by the City of Winnipeg. Please tell me whether you are very dissatisfied, somewhat dissatisfied, somewhat satisfied or very satisfied with each of the following services. ((excluding Don’t know/Refused). 2025 n=437-594)
Condition of major parks (among those who used it)
| Year | Percent who responded very satisfied/somewhat satisfied |
|---|---|
| 2021 | 90% |
| 2022 | 90% |
| 2023 | 88% |
| 2024 | 89% |
| 2025 | 92% |
Note
- In 2025, 85% of those who identified as 18 to 34 years old, and 86% of those who rent their home were satisfied with the condition of major parks.
Insect control
| Year | Percent who responded very satisfied/somewhat satisfied |
|---|---|
| 2021 | 86% |
| 2022 | 84% |
| 2023 | 81% |
| 2024 | 84% |
| 2025 | 83% |
Note
- In 2025, 66% of those who identified as 18 to 34 years old were satisfied with insect control.
Condition of the local park in your neighbourhood (among those who used it)
| Year | Percent who responded very satisfied/somewhat satisfied |
|---|---|
| 2021 | 82% |
| 2022 | 79% |
| 2023 | 80% |
| 2024 | 80% |
| 2025 | 82% |
Note
- In 2025, 72% of those who rent their home were satisfied with the condition of the local park in their neighbourhood.
Snow removal
| Year | Percent who responded very satisfied/somewhat satisfied |
|---|---|
| 2021 | 75% |
| 2022 | 63% |
| 2023 | 66% |
| 2024 | 71% |
| 2025 | 74% |
Note
- In 2025, 61% of those who identified as 18 to 34 years old were satisfied with snow removal.
Management of rush hour traffic flow
| Year | Percent who responded very satisfied/somewhat satisfied |
|---|---|
| 2021 | 62% |
| 2022 | 56% |
| 2023 | 54% |
| 2024 | 53% |
| 2025 | 38% |
City’s efforts to keep city clean and beautiful
| Year | Percent who responded very satisfied/somewhat satisfied |
|---|---|
| 2021 | 65% |
| 2022 | 55% |
| 2023 | 58% |
| 2024 | 59% |
| 2025 | 56% |
Condition of major streets
| Year | Percent who responded very satisfied/somewhat satisfied |
|---|---|
| 2021 | 61% |
| 2022 | 41% |
| 2023 | 44% |
| 2024 | 45% |
| 2025 | 43% |
Condition of residential streets in your neighbourhood
| Year | Percent who responded very satisfied/somewhat satisfied |
|---|---|
| 2021 | 51% |
| 2022 | 39% |
| 2023 | 47% |
| 2024 | 45% |
| 2025 | 37% |
Satisfaction with Community Services
Question 35/Question 37/Question 38/Question 39/Question 40/Question 49/Question 51 -- Now, I'm going to read you a list of services that are provided by the City of Winnipeg. Please tell me whether you are very dissatisfied, somewhat dissatisfied, somewhat satisfied or very satisfied with each of the following services. ((excluding Don’t know/Refused). 2025 n=119-501)
Public Library Services (among those who used it)
| Year | Percent who responded very satisfied/somewhat satisfied |
|---|---|
| 2021 | 93% |
| 2022 | 85% |
| 2023 | 84% |
| 2024 | 83% |
| 2025 | 91% |
Community Centre operated programs (among those who used it)
| Year | Percent who responded very satisfied/somewhat satisfied |
|---|---|
| 2021 | 89% |
| 2022 | 89% |
| 2023 | 81% |
| 2024 | 78% |
| 2025 | 85% |
Support for arts, entertainment & culture
| Year | Percent who responded very satisfied/somewhat satisfied |
|---|---|
| 2021 | 82% |
| 2022 | 82% |
| 2023 | 83% |
| 2024 | 82% |
| 2025 | 84% |
Condition of City of Winnipeg Community Centres (among those who used it)
| Year | Percent who responded very satisfied/somewhat satisfied |
|---|---|
| 2021 | 75% |
| 2022 | 79% |
| 2023 | 75% |
| 2024 | 74% |
| 2025 | 78% |
City-operated recreation programs (among those who used it)
| Year | Percent who responded very satisfied/somewhat satisfied |
|---|---|
| 2021 | 83% |
| 2022 | 86% |
| 2023 | 67% |
| 2024 | 69% |
| 2025 | 78% |
Condition of City-operated recreation facilities (among those who used it)
| Year | Percent who responded very satisfied/somewhat satisfied |
|---|---|
| 2021 | 75% |
| 2022 | 76% |
| 2023 | 70% |
| 2024 | 71% |
| 2025 | 68% |
Efforts to ensure that residential property standards are met through inspections
| Year | Percent who responded very satisfied/somewhat satisfied |
|---|---|
| 2021 | 72% |
| 2022 | 66% |
| 2023 | 68% |
| 2024 | 70% |
| 2025 | 48% |
Note
- There are no demographic subgroups more likely to strongly or somewhat agree with these customer service details.
Satisfaction with Police Service
Question 24/ Question 25/ Question 46 -- Now, I'm going to read you a list of services that are provided by the City of Winnipeg. Please tell me whether you are very dissatisfied, somewhat dissatisfied, somewhat satisfied or very satisfied with each of the following services. ((excluding Don’t know/Refused). 2025 n=141-546)
Enforcement of traffic laws
| Year | Percent who responded very satisfied/somewhat satisfied |
|---|---|
| 2021 | 71% |
| 2022 | 68% |
| 2023 | 68% |
| 2024 | 66% |
| 2025 | 57% |
Police Service response to 911 calls (among those who used it)
| Year | Percent who responded very satisfied/somewhat satisfied |
|---|---|
| 2021 | 69% |
| 2022 | 63% |
| 2023 | 60% |
| 2024 | 60% |
| 2025 | 64% |
Police service efforts in crime prevention
| Year | Percent who responded very satisfied/somewhat satisfied |
|---|---|
| 2021 | 70% |
| 2022 | 70% |
| 2023 | 58% |
| 2024 | 60% |
| 2025 | 48% |
Note
- In 2025, 64% of those who identified as 55+ years old, and 20% of those who identified as a visible minority were satisfied with police service efforts in crime prevention.
Satisfaction with Fire Paramedic Services
Question 17/ Question 44/ Question 47/ Question 48 -- Now, I'm going to read you a list of services that are provided by the City of Winnipeg. Please tell me whether you are very dissatisfied, somewhat dissatisfied, somewhat satisfied or very satisfied with each of the following services. ((excluding Don’t know/Refused). 2025 n=55-383)
Note
- 2025 is reported out of those who used it. Previous years are reported out of all residents.
Fire and rescue service response to fire emergencies (among those who used it)
| Year | Percent who responded very satisfied/somewhat satisfied |
|---|---|
| 2021 | 93% |
| 2022 | 88% |
| 2023 | 88% |
| 2024 | 88% |
| 2025 | 86% |
Fire and injury prevention education
| Year | Percent who responded very satisfied/somewhat satisfied |
|---|---|
| 2021 | 85% |
| 2022 | 79% |
| 2023 | 82% |
| 2024 | 82% |
| 2025 | 79% |
Safety of existing buildings through fire inspections and enforcement
| Year | Percent who responded very satisfied/somewhat satisfied |
|---|---|
| 2021 | 85% |
| 2022 | 81% |
| 2023 | 75% |
| 2024 | 72% |
| 2025 | 73% |
Emergency response capability for medical emergencies (among those who used it)
| Year | Percent who responded very satisfied/somewhat satisfied |
|---|---|
| 2021 | 84% |
| 2022 | 74% |
| 2023 | 70% |
| 2024 | 69% |
| 2025 | 73% |
Satisfaction with Planning, Property & Development
Question 16/ Question 18/ Question 19/ Question 20/ Question 29/ Question 45/ Question Q51A -- Now, I'm going to read you a list of services that are provided by the City of Winnipeg. Please tell me whether you are very dissatisfied, somewhat dissatisfied, somewhat satisfied or very satisfied with each of the following services. ((excluding Don’t know/Refused). 2025 n=337-528)
Efforts in preserving heritage buildings
| Year | Percent who responded very satisfied/somewhat satisfied |
|---|---|
| 2021 | 81% |
| 2022 | 77% |
| 2023 | 76% |
| 2024 | 75% |
| 2025 | 77% |
Efforts in promoting economic development
| Year | Percent who responded very satisfied/somewhat satisfied |
|---|---|
| 2021 | 72% |
| 2022 | 67% |
| 2023 | 67% |
| 2024 | 67% |
| 2025 | 60% |
Note
- In 2025, 70% of those who identified as 55+ years old were satisfied with efforts to promote economic development.
Zoning regulations and building permits
| Year | Percent who responded very satisfied/somewhat satisfied |
|---|---|
| 2021 | 62% |
| 2022 | 60% |
| 2023 | 62% |
| 2024 | 60% |
| 2025 | 51% |
Efforts to address climate change
| Year | Percent who responded very satisfied/somewhat satisfied |
|---|---|
| 2025 | 48% |
Community planning to guide growth and change
| Year | Percent who responded very satisfied/somewhat satisfied |
|---|---|
| 2021 | 66% |
| 2022 | 64% |
| 2023 | 62% |
| 2024 | 64% |
| 2025 | 43% |
Downtown renewal
| Year | Percent who responded very satisfied/somewhat satisfied |
|---|---|
| 2021 | 59% |
| 2022 | 54% |
| 2023 | 47% |
| 2024 | 48% |
| 2025 | 40% |
Funding for improving inner city housing
| Year | Percent who responded very satisfied/somewhat satisfied |
|---|---|
| 2021 | 53% |
| 2022 | 49% |
| 2023 | 49% |
| 2024 | 52% |
| 2025 | 34% |
Satisfaction with Water and Waste
Question 30 to Question 34 -- Now, I'm going to read you a list of services that are provided by the City of Winnipeg. Please tell me whether you are very dissatisfied, somewhat dissatisfied, somewhat satisfied or very satisfied with each of the following services. ((excluding Don’t know/Refused). 2025 n=491-587)
Protection from river flooding
| Year | Percent who responded very satisfied/somewhat satisfied |
|---|---|
| 2021 | 90% |
| 2022 | 80% |
| 2023 | 89% |
| 2024 | 84% |
| 2025 | 93% |
Note
- In 2025, 85% of those who rent their home were satisfied with protection from river flooding.
Quality of the drinking water
| Year | Percent who responded very satisfied/somewhat satisfied |
|---|---|
| 2021 | 84% |
| 2022 | 81% |
| 2023 | 81% |
| 2024 | 81% |
| 2025 | 90% |
Note
- In 2025, 80% of those who rent their home were satisfied with the quality of the drinking water.
Garbage and recycling collection
| Year | Percent who responded very satisfied/somewhat satisfied |
|---|---|
| 2021 | 90% |
| 2022 | 84% |
| 2023 | 87% |
| 2024 | 84% |
| 2025 | 88% |
Other recycling programs, such as 4R and community recycling depots
| Year | Percent who responded very satisfied/somewhat satisfied |
|---|---|
| 2021 | 86% |
| 2022 | 80% |
| 2023 | 82% |
| 2024 | 78% |
| 2025 | 84% |
Satisfaction with Transit / SOAs
Question 26/ Question 43/ Question 50 -- Now, I'm going to read you a list of services that are provided by the City of Winnipeg. Please tell me whether you are very dissatisfied, somewhat dissatisfied, somewhat satisfied or very satisfied with each of the following services. ((excluding Don’t know/Refused). 2025 n=213-562)
Animal services
| Year | Percent who responded very satisfied/somewhat satisfied |
|---|---|
| 2021 | 85% |
| 2022 | 84% |
| 2023 | 81% |
| 2024 | 80% |
| 2025 | 81% |
Note
- In 2025, 90% of those who identified as 55+ years old were satisfied with animal services.
Availability and convenience of on-street parking
| Year | Percent who responded very satisfied/somewhat satisfied |
|---|---|
| 2021 | 66% |
| 2022 | 56% |
| 2023 | 59% |
| 2024 | 70% |
| 2025 | 60% |
Note
- In 2025, 48% of those who identified as 18 to 34 years old, and 33% of those who identified as a visible minority, were satisfied with the availability and convenience of on-street parking.
Public transit (among those who used it)
| Year | Percent who responded very satisfied/somewhat satisfied |
|---|---|
| 2021 | 69% |
| 2022 | 68% |
| 2023 | 55% |
| 2024 | 55% |
| 2025 | 46% |
Note
- There are no demographic subgroups more likely to be satisfied with transit / SOAs.
Use of City Services
Visited a local neighbourhood park
Question 58 -- Have you visited your local neighbourhood park in the past year? (excluding Don’t know/Refused). 2025 n=593)
| Year | Percent who used in the past year |
|---|---|
| 2021 | 83% |
| 2022 | 83% |
| 2023 | 87% |
| 2024 | 84% |
| 2025 | 86% |
Note
- In 2025, 79% of those 55+ years old visited a local neighbourhood park.
Visited a major park
Question 59 -- Have you visited a major park like Kildonan Park or St. Vital Park in the past year? (excluding Don’t know/Refused). 2025 n=589)
| Year | Percent who used in the past year |
|---|---|
| 2021 | 71% |
| 2022 | 79% |
| 2023 | 79% |
| 2024 | 79% |
| 2025 | 77% |
Note
- In 2025, 47% of those of those who make less than $30,000 per year visited a major park.
Visited one of the City's public libraries
Question 64 -- Have you or someone in your family visited at least one of the City's public libraries in the past year? (excluding Don’t know/Refused). 2025 n=584) (Wording changed in 2025)
| Year | Percent who used in the past year |
|---|---|
| 2021 | 52% |
| 2022 | 54% |
| 2023 | 57% |
| 2024 | 58% |
| 2025 | 71% |
Attended a local Community Centre Facility
Question 55 -- Have you attended your local Community Centre Facility in the past year? (excluding Don’t know/Refused). 2025 n=586)
| Year | Percent who used in the past year |
|---|---|
| 2021 | 28% |
| 2022 | 36% |
| 2023 | 49% |
| 2024 | 51% |
| 2025 | 50% |
Note
- In 2025, 65% of those 35 to 54 years old attended a local Community Centre Facility.
Visited a City Recreational Facility
Question 54 -- Have you visited a City Recreational Facility like a pool or leisure centre in the past year? ((excluding Don’t know/Refused). 2025 n=589)
| Year | Percent who used in the past year |
|---|---|
| 2021 | 27% |
| 2022 | 34% |
| 2023 | 48% |
| 2024 | 51% |
| 2025 | 47% |
Note
- In 2025, 73% of those who identified as Indigenous visited a City recreational facility.
Use City Transit at least once a week
Question 60 -- Have you used the City’s transit service at least once a week in the past year? ((excluding Don’t know/Refused). 2025 n=594) (Wording changed in 2025)
| Year | Percent who used in the past year |
|---|---|
| 2021 | 21% |
| 2022 | 20% |
| 2023 | 23% |
| 2024 | 24% |
| 2025 | 37% |
Notes
- In 2025, the following demographics use City transit at least once a week:
- 71% make less than $30,000 per year
- 57% 18 to 34 years old
- 59% identify as 2SLGTQIA+
- 61% identify as a visible minority
- 59% rent their home
Participated in a City Recreational Program
Question 56 -- Have you or someone in your family participated in a City Recreational Program like swimming lessons, Learn to Skate or other Leisure Guide Programs in the past year? ((excluding Don’t know/Refused). 2025 n=585)
| Year | Percent who used in the past year |
|---|---|
| 2021 | 24% |
| 2022 | 27% |
| 2023 | 34% |
| 2024 | 40% |
| 2025 | 27% |
Been involved in an emergency medical incident
Question 61 -- In the past year, have you or a family member been involved in an emergency medical incident where paramedics were requested? ((excluding Don’t know/Refused). 2025 n=593)
| Year | Percent who used in the past year |
|---|---|
| 2021 | 24% |
| 2022 | 26% |
| 2023 | 26% |
| 2024 | 31% |
| 2025 | 27% |
Contacted the Winnipeg Police Service
Question 62 -- In the past year, excluding traffic related matters, during the last 12 months did you contact the Winnipeg Police Service for any reason? ((excluding Don’t know/Refused). 2025 n=589) (Wording changed in 2025)
| Year | Percent who used in the past year |
|---|---|
| 2021 | 18% |
| 2022 | 20% |
| 2023 | 23% |
| 2024 | 24% |
| 2025 | 26% |
Note
- In 2025, 50% of those who identified as Indigenous contacted the Winnipeg Police Service.
Participated in a Community Centre Program
Question 57 -- Have you or your family participated in a Community Centre Program like hockey or soccer in the past year? ((excluding Don’t know/Refused). 2025 n=589)
| Year | Percent who used in the past year |
|---|---|
| 2021 | 23% |
| 2022 | 23% |
| 2023 | 31% |
| 2024 | 36% |
| 2025 | 25% |
Called 911 for a response to a fire
Question 64A -- Have you or someone in your family called 911 for a response to a fire in the past year? ((excluding Don’t know/Refused). 2025 n=592) (First asked in 2025)
| Year | Percent who used in the past year |
|---|---|
| 2025 | 10% |
Note
- In 2025, 27% of those who identified as Indigenous called 911 for a response to a fire.
Applied for a building permit
Question 63 -- Have you applied for a building permit in the past year? ((excluding Don’t know/Refused). 2025 n=590)
| Year | Percent who used in the past year |
|---|---|
| 2021 | 6% |
| 2022 | 8% |
| 2023 | 8% |
| 2024 | 6% |
| 2025 | 5% |
Key Findings
Quality of Life Indicators
- The majority of Winnipeggers (86%) rate the overall quality of life in the City as very good or good. After four consecutive years of decline, 2025 sees a positive shift from 82% last year.
- Over the past five years, there has been a consistent decline in ratings of ease of getting around by transit (down 14 points over the last five years and five points from last year).
- Ratings for ease of getting around by walking or by bicycle both dropped by at least 10 percentage points from last year.
- The most common actions cited to improve the quality of life in Winnipeg are related to crime and policing (44%, up eight points), followed by housing/social programs (36%, up five points) and roads/infrastructure (29%, down 10 points).
Net Promoter Score
- Just over one in four residents (27%) are promoters of the City of Winnipeg, but the overall 2025 Net Promoter Score sits at -8, which is the highest rating in the past four years (+1 in 2021).
Value for Tax Dollars
- 57% of residents feel that they receive good or very good value for their property tax dollars, which is on par with the past few years.
- The most common reasons for finding good value for property tax dollars are general satisfaction with the city (28%), satisfaction with snow clearing (17%) and satisfaction with garbage and recycling (14%). Few also identify that there is always room for improvement (19%).
- The most common reasons finding poor value for property tax dollars are dissatisfaction with roads (40%) and dissatisfaction with City spending (31%).
Customer Service
- 55% of Winnipeggers contacted the City in the past year, similar to 2024 (54%). Residents most commonly contacted the City by phone (80%), although email (34%) and completing an online form (33%) have continued to grow over the past five years.
- Satisfaction with customer service remains somewhat high at 75%, although down from 78% last year.
- Amongst four aspects of customer service, ratings are highest for City staff being courteous, helpful and knowledgeable (89%). Three of the four ratings are up from last year, although just two to five percentage points.
City Services
- Overall satisfaction with city services is 72%, down from 76% last year and the lowest in the last five years.
- Satisfaction with city services remains high for most services. Although about half city services have decreased from 2024, five decreased by more than 10 percentage points.
- Efforts to ensure that residential property standards are met through inspections (48% - down 22%)
- Community planning to guide growth and change (43% - down 21%)
- Funding for improving inner city housing (34% - down 18%)
- Management of rush hour traffic flow (38% - down 15%)
- Police efforts in crime prevention (48% - down 12%)
- Conversely, a few services increased by more than seven percentage points:
- Efforts to address climate change (48% - new to 2025)
- Protection from river flooding (93% - up 10%)
- City operated recreation programs (78% - up 9%)
- Quality of drinking water (90% - up 9%)
- Public library services (91% - up 8%)
- Individual city services that received under 50% satisfaction ratings:
- Efforts to address climate change (48% - new to 2025)
- Efforts to ensure that residential property standards are met through inspections (48% - down 22%)
- Police efforts in crime prevention (48% - down 12%)
- Public transit (46% - down 9%)
- Condition of major streets (43% - down 2%)
- Community planning to guide growth and change (43% - down 21%)
- Downtown renewal (40% - down 8%)
- Management of rush hour traffic flow (38% - down 15%)
- Condition of residential streets in your neighbourhood (37% - down 8%)
- Funding for improving inner city housing (34% - down 18%)