
Introduction
The City’s 2024 Infrastructure Plan incorporates a four-year update that expands upon the information previously outlined in the 2020 Infrastructure Plan and makes connections to primary and secondary planning documents such as OurWinnipeg 2024, Complete Communities 2.0, Poverty Reduction Strategy and the Climate Change Action Plan. The Infrastructure Plan also makes connections to the themes recognized in the Strategic Priorities Action Plan (SPAP).
Having additional insight and a broad overview of the City’s infrastructure needs and financial reality, the Infrastructure Plan is intended to be a 10-year blueprint for maintaining sustainable and affordable service delivery for residents by incorporating the information from the Infrastructure Plan into the City’s investment planning cycle and multiyear budget process.
Departments will use the Infrastructure Plan on an annual basis to guide their investment planning efforts based on aligned capital priorities and budget availability.
Using feedback received from internal and external stakeholders, a number of improvements have been made to facilitate access to data, increase transparency and illustrate alignment to key priorities. This has mainly been accomplished through the development of an interactive Infrastructure Plan allowing users to navigate through various departments, services and strategies.
The Infrastructure Plan has also been reformatted to provide a service-based view of prioritized needs that incorporates projects and programs inclusive of tax, utility supported services and special operating agencies, over $5 million. With the inclusion of programs, this version of the Infrastructure Plan constitutes almost 100% of the City’s total forecasted ($4.8B) and unfunded ($8.0B) capital needs over the next 10 years with a combined total Capital Plan of $12.8 billion.
The Infrastructure Plan is not the Capital Budget.
Investments that are approved in the Capital Budget ultimately provide the public service direction to initiate projects and execute them using the City’s project management process. As such, the Capital Budget solidifies the City’s strategies and overall goals and how those objectives will be achieved by outlining specific activities, resources and timing.
The following figure outlines the recommended process flow to integrate the Infrastructure Plan with capital budgeting
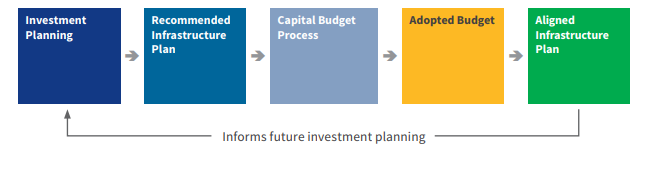
Figure 1: Integrating the Infrastructure Plan with capital budgeting
Figure outlines the recommended process flow to integrate the Infrastructure Plan with capital budgeting.
- Investment planning
- Recommended infrastructure plan
- Capital budget process
- Adopted budget
- Aligned infrastructure plan (informs future investment planning)
Organizational context
The 2024 Infrastructure Plan presents a 10-year capital investment outlook that utilized various strategic documents to support its development. These documents have provided a city-wide view of asset information and investment needs the City of Winnipeg will need to address in order to maintain service delivery for residents. Using the Infrastructure Plan to support the development of a long-term investment strategy will allow for more informed decision-making throughout the multi-year budgeting process.
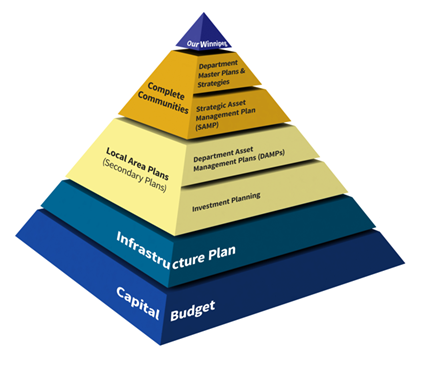
Figure 2: Organizational context
Pyramid diagram to depict how OurWinnipeg 2045 Development Plan at the top of the pyramid disseminates into Complete Communities, as well as Department Master Plans & Strategies and the Strategic Asset Management Plan (SAMP) in the pyramid sections below. These lead into Local Area Plans or Secondary Plans, and Department Asset Management Plans (DAMP’s) and Investment Planning in the pyramid sections below. The last 2 sections of the pyramid are the Infrastructure Plan followed by the Capital Budget.
OurWinnipeg 2045
The OurWinnipeg 2045 Development Plan is the City’s comprehensive 25-year plan that articulates the City’s goals and aspirations at the highest level, and serves to guide the physical, social, environmental and economic objectives and sustainable land uses and development of the city. It localizes United Nations Sustainable Development Goals into six key goals for the City of Winnipeg, including Leadership and Good Governance, Environmental Resilience, Economic Prosperity, Good Health and Well-being, Social Equity, and City Building. OurWinnipeg 2045 will serve to align all other statutory and strategic city documents such as shorter term corporate strategic plans, including the Strategic Priorities Action Plan (SPAP), council policies including Poverty Reduction Strategy and Climate Action Plan, budgets and implementation tools on specific issues or areas.
By coordinating the investments identified in the Infrastructure Plan to align with the longer-term goals of OurWinnipeg 2045, the city is able to connect the dots between infrastructure investment needs and effectively delivering on strategic priorities. OurWinnipeg 2045 will also function as accountability tools to validate council investment decisions with policy alignment.
Complete Communities 2.0
Complete Communities 2.0 is a supporting direction strategy to OurWinnipeg 2045. As a city-wide secondary plan, it guides growth, development and land use in the City of Winnipeg. The focus of Complete Communities is to provide a vision around the physical characteristics and an urban structure that creates a framework for the City’s future physical growth and development.
Complete Communities 2.0 outlines key steps required to implement the plan and “make it work”, including:
- Establishing a residential intensification target that provides high-level direction for decision making and anchors other plan policies.
- Identifying a preferred phasing of greenfield areas that aligns with the Infrastructure Plan to allow for more efficient allocation of resources by the City of Winnipeg and greater predictability for everyone.
- Prioritizing infrastructure and planning that best support complete communities’ principles, using a criteria-based evaluation.
Intensification target
The intensification target established by Complete Communities 2.0 states that a minimum of 50% of all new dwelling units be accommodated in the existing built-up area of the city – known as the Intensification Target Area. To achieve this target, the City will need to expend considerable efforts in making new development in these areas easier, more desirable and more predictable. By mapping growth supportive and growth enabling investments occurring within the Intensification Target area, the City is acknowledging proactive investments that must be made in order for infill development to occur; by making this information public it is increasing overall investment needs transparency.
Greenfield development
To accommodate forecasted demand for housing, the City needs to continually make timely investments in growth-enabling infrastructure and local area planning. In prescribing greenfield phasing policies, Complete Communities 2.0 provides direction with respect to the timing and sequencing of these investments.
Complete Communities 2.0 directs the City to maintain a five-to-seven year supply of vacant residential land where all growth-enabling infrastructure is funded, and a three-to-five year supply where it is infrastructure is installed. The timing of these enabling investments should be determined by working backwards from these targets using an up-to-date understanding of City land supplies. This is provided in the annual Complete Communities Land Monitoring report.
By aligning the planned phasing of its greenfield land with its infrastructure priorities, the City can more efficiently manage its resources and provide greater predictability and certainty around development approvals and infrastructure investment.
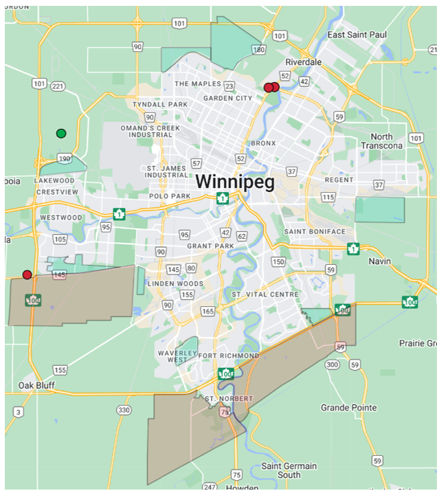
Figure 3: Growth-enabling location specific investments in 2024 Infrastructure Plan
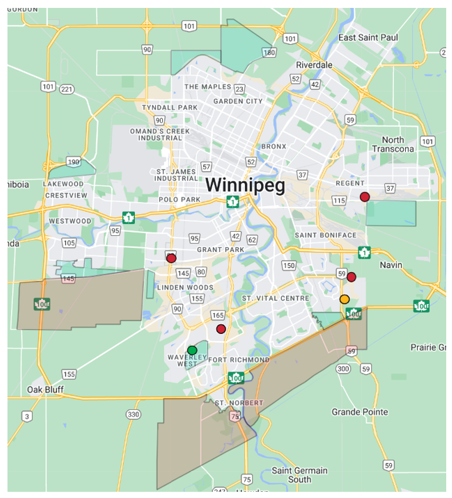
Figure 4: Growth-supportive location specific investments in 2024 Infrastructure Plan
A map of the City of Winnipeg that presents the location of growth-enabling investments that are both forecasted and unfunded, as they relate spatially to areas of greenfield land that are to be prioritized over the short-to-medium and long term.
A map of the City of Winnipeg that presents the location of growth-supportive investments that are forecasted, partially forecasted and unfunded, as they relate spatially to the areas of greenfield land that are to be prioritized over the short-to-medium and long term.
To view these maps and the corresponding projects in greater detail, visit the interactive Infrastructure Plan.
Growth-related infrastructure
Growth-enabling infrastructure – This includes regional-scale infrastructure that is a prerequisite to development. Without this infrastructure, growth in the identified development area would not happen or could be delayed, without the initiation or completion of the planned investment. Common examples include water feeder mains, wastewater interceptors, and development of major roads into undeveloped areas of the city.
Examples of growth-enabling investments include:
- Chief Peguis Trail Extension West - Main to Brookside.
- Southwest Interceptor River Crossing.
Growth-supportive infrastructure – This includes regional-scale infrastructure that is not a prerequisite to development but is needed to support the targeted levels of service for the community. Supporting infrastructure such as fire stations and recreation facilities are essential to creating complete communities. While not a prerequisite to development, this is infrastructure that may be expected by residents to be provided over a neighbourhood’s build-out as essential to creating complete communities, without which may impact one’s decision to live within the affected area. It may be prudent to ask, “If this service wasn’t readily available to me, would I still decide to live in the area?”. If the answer is “no”, then the infrastructure is likely a key, supportive element to the community.
Examples of growth-supportive projects include:
- Waverley West Fire Station –Having this project completed in a timely manner would ensure the area continues to provide appropriate levels of service for a safe community.
- Southeast Neighbourhood Recreation & Leisure Centre – This project supports growth by bringing a community together, increasing the residents’ opportunity for health, comfort and happiness.
- Route 90 Improvements - Taylor to Ness – Developments within this area would likely occur without this investment. However, these improvements support/connect neighbourhoods east and west of Route 90, therefore supporting future developments.
In order to demonstrate alignment between investments identified in the Infrastructure Plan and Complete Communities 2.0, the Plan will report on the growth-supportive and growth-enabling investments.
Strategic alignment
City-wide strategies & plans
Strategic Priorities Action Plan (SPAP)
The 2023-2026 Strategic Priorities Action Plan reflects Council’s key priorities and actions for their four-year Council term. Council identified five key priority themes and 42 priority actions for strategic focus and investment. The SPAP fills an important gap by providing a bridge to help link long-term City plans like OurWinnipeg2045, Winnipeg’s Climate Action Plan, the Winnipeg Transit Master Plan, Winnipeg Recreation Strategy, Transportation Master Plan, Winnipeg Parks Strategy and the Winnipeg Poverty Reduction Strategy, with the needs that residents have articulated to Council members during the election campaign. The SPAP is a living plan to help the City respond more nimbly, effectively, and confidently to the needs of our community. Each investment within the Infrastructure Plan is linked to a SPAP priority theme. By showing the investments that support each theme, the SPAP can be a tool to show progress and accountability for priority actions.
Poverty Reduction Strategy
The City’s Poverty Reduction Strategy, adopted by Council in November 2021, is a 10-year strategy focused on long-term, sustainable and practical solutions to address the immediate and emergent needs of community members. To better understand community needs, the City has a map to show the geographical areas of high poverty using data from the 2016 Census for the City of Winnipeg. This map highlights areas of the city that have a high concentration of residents living with low incomes, who subsequently may have increased need for City and community-based services, programs and supports.
The Poverty Reduction Strategy and its implementation plan notes that these geographical areas of Higher Poverty should be priority focus areas for capital investments that support City programs and services and assess whether these capital investments are serving areas of higher poverty areas. To make a connection between the Infrastructure Plan and the Poverty Reduction Strategy, the Infrastructure Plan will identify the investments occurring in these geographical areas of higher poverty.
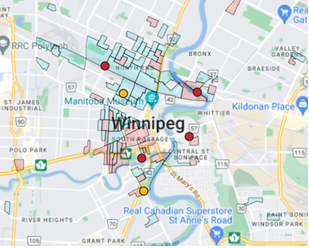
Figure 5: Geographical areas of higher poverty
A map of the City of Winnipeg that presents geographical areas of higher poverty and concentrated poverty. Investments that are located in these areas are also depicted as forecasted, unfunded, or partially forecasted.
Climate Action Plan
Winnipeg’s Climate Action Plan provides a framework to proactively, meaningfully, and effectively mitigate climate change by reducing greenhouse gas emissions. During the investment planning process, environmental impact is assessed when departments bring forth projects, using the City’s Asset Management Prioritization tool. Investments that align with the plan, demonstrate greater benefits and can therefore be prioritized higher than a similar project, in scope and cost, that does not incorporate positive, environmental benefits.
Strategic Asset Management Plan (SAMP)
The SAMP documents the City’s strategic approach to asset management, lays out the roadmap to continue to build its asset management system, describes performance metrics, and provides the basis for ongoing assessment of organizational asset management maturity.
One of the SAMPs key objectives was to develop a Levels of Service (LOS) framework. Establishing LOS is foundational to developing an asset management program that balances costs, opportunities, and risks against the desired LOS. Having a clearly defined LOS framework allows strategic objectives to be linked with customer expectations and the technical performance of an asset. It also allows staff to use target levels of service as a baseline during lifecycle analysis and to evaluate the impacts of changes to LOS.
The City recently established a LOS Framework as illustrated in Figure 6. It aims to align corporate objectives by defining both customer and technical LOS including key service attributes, level of service statements, performance measures, and key performance indicators. The LOS framework will include a sufficiently detailed repeatable process to enable the City to use the same process to establish LOS for all services the City provides.
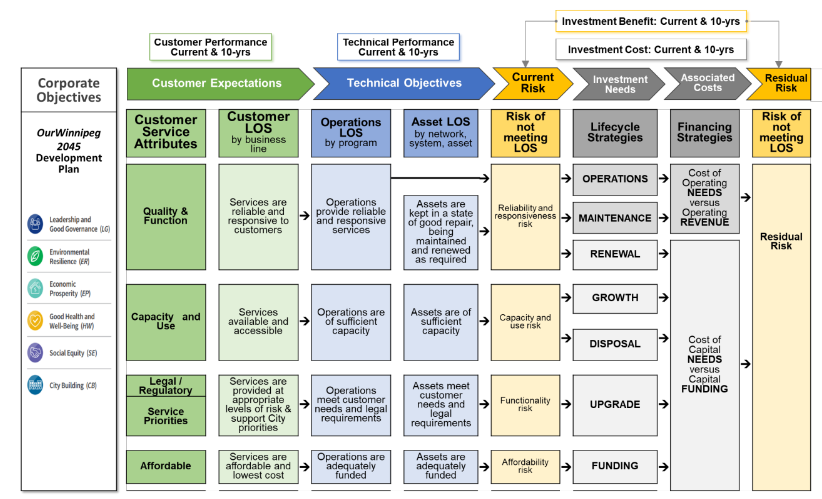
Figure 6: City of Winnipeg level of service framework
Figure to describe the recently established Levels of Service framework that aims to align corporate objectives with customer expectations and technical objectives. The framework details the Levels of Service as it relates to the 6 OurWinnipeg 2045 Development Plan Corporate Objectives.
There are 6 corporate objectives identified by OurWinnipeg, and all Levels of Service Customer Expectations, Technical objectives, Current Risk, Investment Needs, Associated Costs and Residual Risk can be categorized into one or more of the objectives.
- Leadership and Good Governance
- Environmental Resilience
- Economic Prosperity
- Good Health and Well-being
- Social equity
- City Building
Lifecycle management
All assets have a lifecycle and understanding the timing for the appropriate lifecycle activities for maintaining a targeted level of service delivery is crucial. Deciding on whether to acquire a new asset, repair or replace an existing asset and the timing of when the investment is made can be facilitated though a lifecycle cost analysis.
Having a holistic overview of the total cost of owning an asset helps optimize the organization’s ability to financially support and receive full value from the asset and the services it provides. Total asset lifecycle costs account for the capital and operating expenses incurred during all the stages of asset ownership and have been categorized into their respective lifecycle activities including; renewal, upgrade, growth, operations & maintenance and disposal.
Renew – An activity to rehabilitate or replace an existing asset to restore equivalent quality, capacity or function.
Upgrade – An activity to improve an existing asset to achieve enhanced fit for purpose, new strategic priorities or regulatory requirements.
Growth – An activity to provide a net new asset that did not exist previously or an expansion to an existing asset.
Operations & maintenance – Regular activities to provide services which will consume resources (such as labour, energy, chemicals and materials) or regular on-going activities necessary to keep assets operating, including instances where portions of the asset fail and need immediate repair to make the asset operational again (excluding renewal).
Disposal – Any activity associated with the offboarding of an asset including sale, demolition, or abandonment. Disposal of assets are not intended to be replaced by a similar asset after decommissioning.
Figure 7 categorizes the amount of unfunded needs that are required within each lifecycle activity as defined. It is evident that the majority of needs reside within the renewal and growth-related activities. Some of the larger contributors for unfunded renewals include the Health/Life Safety/Emergency Systems program, Community Centre Capital Renewal program and the Arlington Bridge replacement. The largest contributing growth-related projects are associated with the Chief Peguis extension and Route 90 improvements.
Disposal activities are minimal as the City does not have a strong impetus to remove assets from service once they are beyond their useful life. At times, this can be detrimental to the levels of service targets for a particular asset as the age and condition of the asset can compromise functionality, reduce the quality of service and incur additional costs.
Also note that although the Operations & Maintenance category has been left blank, the City has substantial costs associated with operational activities that are presented in the Operating Budget. Some services like Snow Removal and Ice Control and City Beautification are mainly operational in nature and thus are not represented as unfunded capital needs.
Future opportunities to categorize Operations & Maintenance costs within the designated services will be considered for future iterations of the Infrastructure Plan as these costs will be a major contributor to the City’s overall infrastructure deficit.
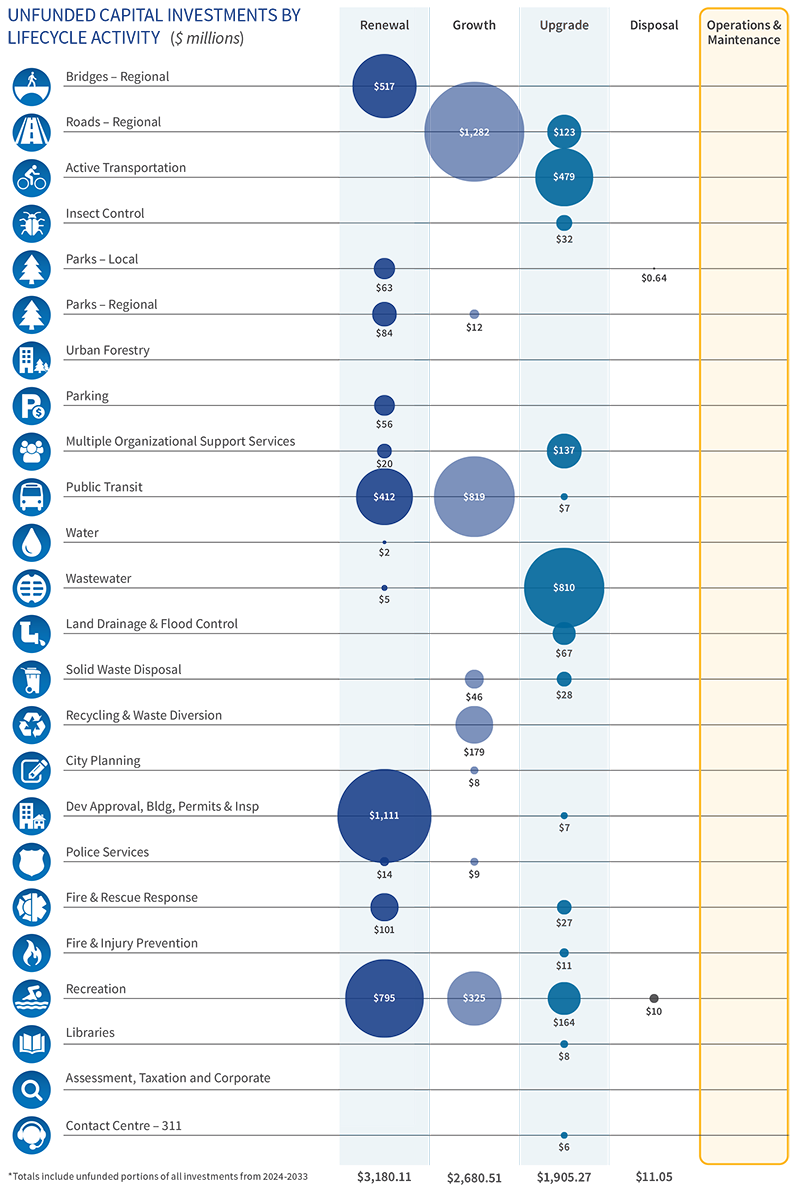
Figure 7: Unfunded capital investments by lifecycle activity
| Lifecycle Activity | |||||
|---|---|---|---|---|---|
| Renew | Growth | Upgrade | Disposal | Operations & Maintenance | |
| Bridges - Regional | $517 | $- | $- | $- | $- |
| Roads - Regional | $- | $1,282 | $123 | $- | $- |
| Active Transportation | $- | $- | $479 | $- | $- |
| Insect Control | $- | $- | $32 | $- | $- |
| Parks - Local | $63 | $- | $- | $0.64 | $- |
| Parks - Regional | $84 | $12 | $- | $- | $- |
| Urban Forestry | $- | $- | $- | $- | $- |
| Parking | $56 | $- | $- | $- | $- |
| Multiple Organizational Support Services | $20 | $- | $137 | $- | $- |
| Public Transit | $412 | $819 | $7 | $- | $- |
| Water | $2 | $- | $- | $- | $- |
| Wastewater | $5 | $- | $810 | $- | $- |
| Land Drainage & Flood Control | $- | $- | $67 | $- | $- |
| Solid Waste Disposal | $- | $46 | $28 | $- | $- |
| Recycling & Waste Diversion | $- | $179 | $- | $- | $- |
| City Planning | $- | $8 | $- | $- | $- |
| Dev Approval, Bldg, Permits & Insp | $1,111 | $- | $7 | $- | $- |
| Police Services | $14 | $9 | $- | $- | $- |
| Fire & Rescue Response | $101 | $- | $27 | $- | $- |
| Fire & Injury Prevention | $- | $- | $11 | $- | $- |
| Recreation | $795 | $325 | $164 | $10 | $- |
| Libraries | $- | $- | $8 | $- | $- |
| Assessment, Taxation and Corporate | $- | $- | $- | $- | $- |
| Contact Centre - 311 | $- | $- | $6 | $- | $- |
| Totals | $3,180.11 | $2,680.51 | $1,905.27 | $11.05 | $- |
Department strategies & plans
Various strategies and plans were generated out of specific departments, with consideration given for other impacted departments initiatives. It is necessary to align these plan’s timelines and implementation plans to the investments being put forth in the Infrastructure Plan; thus, ensuring coordination with the longer-term goals of the City.
Regional assessment of municipal services
As infill development and densification continue to put increased pressures on existing wastewater, land drainage and water distribution systems the City is currently in the process of developing a process that will gauge capacity availability, restrictions, and limitations for each new construction or re-development application.
The Water and Wastewater Department (WWD) has begun the Review and Assessment of Municipal Services phase of the study, to explore how other Canadian cities determine and communicate capacity constraints, and to develop a pilot study for implementation. This study will identify development application process improvements based on a review of existing processes and a scan of comparable jurisdictions. It is intended to be completed in Spring 2024. This on-going initiative will allow the City to sustainably support growth (including infill) by providing potential developers with meaningful water, wastewater and land drainage data in a timely manner; resulting in a more informed planning process.
Combined Sewer Overflow Master Plan
The City is proceeding with a major infrastructure program called the Combined Sewer Overflow Master Plan, to manage the effects of combined sewer overflows (CSO) on our waterways. This master plan sets out a roadmap for implementing a long-term infrastructure program with the goal of reducing CSO in Winnipeg. The program will include several types of construction projects across all 43 combined sewer districts. After Manitoba Conservation and Climate approved the CSO Master Plan in November of 2019, the City has now entered the implementation phase of the plan. As the implementation of the CSO Master Plan continues many combined sewer separation projects identified within the plan will appear in the Infrastructure Plan as forecasted and unfunded investments.
Read our Combined Sewer Overflow Master Plan.
Transportation Master Plan
The vision of the Transportation Master Plan: 2050 is to ensure the transportation system supports quality of life and economic vitality through safe, efficient, connected and barrier free movement of people and goods using a choice of modes and sustainable infrastructure. The final plan will serve as a 30-year blueprint to guide future investment in Winnipeg’s transportation network through actionable items, implementation recommendations, budgetary implications, performance measures, and future adaptability.
Read about our Transportation Master Plan.
Winnipeg Transit Master Plan
The Winnipeg Transit Master Plan was adopted on April 19, 2021 as the long-range strategic plan for public transit. The plan includes an entirely new transit network to better respond to the needs of residents, with a system that is designed to be resilient, changing and adapting as the city grows. The strategy identifies the long-term infrastructure needs required for the new primary network and rapid transit and includes a list of the highest priority projects.
Recreation Strategy
The City’s Recreation Strategy is a long-term strategic plan designed to guide investment and decisions on recreation services over the next 25 years. The strategy will transform service and work to ensure that new and refurbished facilities are more welcoming, accessible and inclusive for all Winnipeggers. The implementation of this strategy will achieve the renewal and upgrading of existing facilities, development of new facilities to address functionally obsolete facilities or those are the end of their useful life, geographic gaps in provision as well as growth related needs. The strategy identifies prioritized actions and investment needs that support implementation over the short-, medium-, and long-term.
Parks Strategy
The Winnipeg Parks Strategy presents a vision for Winnipeg’s parks and recognizes the parks system’s role as an integral part of Winnipeggers’ way of life, with a vision that directly shapes the Strategy’s values, operating principles, and goals, and sets a framework to achieve five strategic objectives. Strategic objectives that aim to meet community needs, build partnerships, adapt to change and improve access to ensure all Winnipeggers are provided with parks services based on a formalized service delivery approach.
Winnipeg Fire Paramedic Service 2020 Strategic Direction Detail
The Winnipeg Fire Paramedic Service (WFPS) strategic plan was developed to ensure current and future demands are met. Recommendations made by the strategy which consider the WFPS Master Plan, Community Risk Assessment Standards of Cover study, and findings in the Fire Underwriters Survey are organized into four sections: programs, staffing, equipment, and facilities. The strategy acts as a blueprint identifying capital investments required by the city to meet the needs of the community now and into the foreseeable future.
Read our Fire Paramedic Master Plan.
The identification, planning, and design of growth-related infrastructure projects is an iterative process resulting from one or more of these above-described plans. While a master plan may establish a need at a high level, this need is confirmed and specifications are refined as the City’s vision for its enabling land use and development is clarified, first at a high-level through OurWinnipeg and Complete Communities, then through a secondary planning process, and finally upon receipt of development applications. Each step of this process allows the City to update its investment planning to ensure alignment with development expectations.
Investment planning
Framework & evaluation
The Investment Planning Framework within the City’s Asset Management Program follows a five-step process which provides all departments with a robust, transparent and defendable approach for identifying and rationalizing infrastructure investments. By applying the framework, departments are able to justify investments, clearly articulating needs and weighing the costs and benefits associated with competing priorities. The Infrastructure Plan focuses on presenting prioritizing capital investments and demonstrating alignment with strategic priorities to support capital budget development resulting in long-term infrastructure planning.
Ultimately, the decision on what investments to undertake rests with Council. The Public Service aims to provide Council with quality recommendations to assist in the decision-making process.
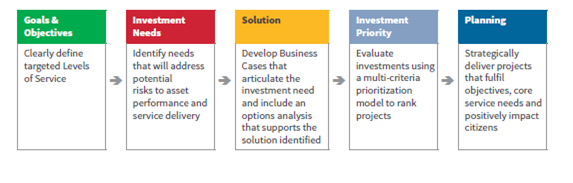
Figure 8: Decision-making process
Figure describes the decision-making process flow
- Goals & objectives – Clearly define targeted Levels of Service
- Investment needs – Identify needs that will address potential risks to asset performance and service delivery
- Solution – Develop Business cases that articulate the investment need and include an options analysis that supports the solution identified
- Investment priority – Evaluate investments using a multi-criteria prioritization model to rank projects
- Planning – Strategically deliver projects that fulfil objectives, core service needs and positively impact citizens
Economic evaluation
Capital investments made by the City may provide tangible and intangible benefits to citizens, businesses, and governments. The procurement and construction of a capital investment impacts the economy by temporarily increasing Gross Domestic Product (GDP) and employment through the building process. Once complete, capital investments may allow for more efficient movement of goods and people, they may enable or encourage transportation modal shift which could reduce carbon emissions and save time, they may enable the development or intensification of residential or employment lands, they may provide improved recreational and leisure opportunities, they may reduce pollution, or may provide some other social or economic benefit to the public.
Undertaking an economic valuation of a capital project involves quantifying the dollar value of the various tangible and non-tangible costs and benefits associated with it. There are three main methods of economic valuation that may be applied to a capital project:
- Economic Impact Assessment: this measures the short-term economic impact on Manitoba and Canada’s economy from the procurement and construction of a major capital project. The benefits are measured in terms of GDP, employment, and provincial/federal tax revenue that are generated by the project’s procurement and construction.
- Financial Impact Assessment: this measures the long-term financial impact on the City of Winnipeg, Manitoba, and Canada that results from a capital project that directly enables the development and/or intensification of new residential and/or employment lands. The benefits are measured in terms of net new municipal, provincial, and federal tax revenue generated upon newly developed/intensified land after taking into consideration all capital and operating costs associated with the new development over a defined benefitting period. However, this assessment aims to take a comprehensive approach to evaluating complete communities and as such, may contrast the financial costs and benefits associated with multiple capital projects required to service new or intensified land uses.
- Benefit-Cost Analysis: This measures and monetizes the social benefits associated with a major capital project over a defined benefiting period. This may include calculating the monetary value of costs and benefits associated with reduced travel times, and/or reduced emissions/pollution, and/or additional recreational opportunities, and/or other quantifiable social benefits to the public.
Not all capital projects require or provide benefits associated with all three types of economic valuations. While all capital projects may have an economic impact assessment conducted to evaluate the impact of their construction on GDP and employment, financial impact analysis is only applicable to capital projects that directly enable new or intensified land uses, and benefit-cost analysis is only applicable to capital projects that provide quantifiable social benefits.
In isolation, economic valuations for individual projects do not provide the best metric to help prioritize infrastructure investments. Rather, economic evaluations are most helpful when they have been conducted on multiple projects competing for limited funding. Economic evaluations help decision-makers and the public understand the monetary value of benefits associated with each project which can then be contrasted to the project's cost, allowing for more efficient allocation of capital budget dollars across competing proposals.
Infrastructure Plan
Scope & purpose
The Infrastructure Plan has been reformatted to provide a service-based view of prioritized needs that incorporates projects and programs inclusive of tax, utility supported services and special operating agencies, over $5 million.
Developments to the evaluation process for programs have been incorporated since the 2020 Infrastructure Plan, allowing the 2024 Infrastructure Plan to perform a side-by-side assessment for both programs and projects. Additionally, the Infrastructure Plan provides an all-encompassing view of investments greater than $5M which are forecasted, partial and unfunded. Showing the forecasted and partial investments allows for more transparency of capital investments.
Programs are a collection of smaller (like) projects and activities that are managed in a coordinated way to achieve an impact that is either greater or not available if they were managed individually. Programs are typically longer term or with no end date, and often managed across functional units, strategic in nature and the plan is often high level or evolving. Often these programs focus on the renewal of assets and maintenance programs, but can also include groups of projects with varying scopes that benefit a shared service area or groups of similar projects that deliver similar benefits to unrelated service areas.
Projects are capital investments that have a unique purpose and produce a specific outcome. These projects are often large and complex but have a defined scope along with start and end point.
The Infrastructure Plan is not to be confused with the City’s capital budget. The Infrastructure Plan is meant to capture a cross-service view of the City’s 10-year infrastructure needs by outlining capital priorities and the limited availability of funding to support these investments. Enhanced decision-making is facilitated by demonstrating links between capital investments, benefits, and alignment with long term corporate objectives.
The City Infrastructure Plan will guide the City’s investment planning efforts in alignment with several guiding city documents including the City’s Asset Management Plan, State of the Infrastructure Report, OurWinnipeg 2045, Complete Communities 2.0, Winnipeg’s Climate Action Plan, Poverty Reduction Strategy and Departmental Master Plans.
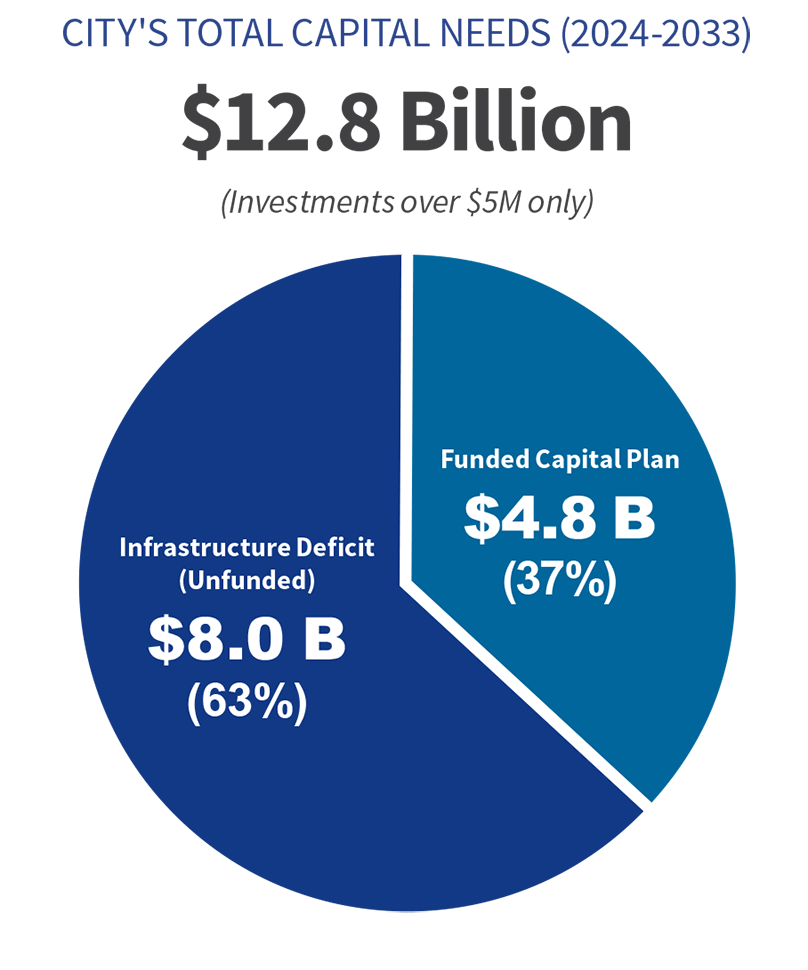
Figure 9: City’s total capital needs
Pie chart showing the city’s total capital needs, based on capital investments $5M and over, from 2024 to 2033 at $12.8 billion. The $8.0 billion deficit represents 63% of the pie and the remaining 37% pie is the funded and forecasted capital plan at $4.8 billion.
Within the Infrastructure Plan approximately 63 percent of the City’s total capital needs from 2024-2033 are unfunded, forming the infrastructure deficit. This includes tax, utility supported services and special operating agencies.
The remaining 37 percent of capital needs are funded and forecasted projects and programs over $5 million for the same ten-year span. All capital service needs greater than $5 million have been identified within this iteration of the Plan.
For clarity, the investments under $5 million make up only 2% of the City’s entire total capital needs and therefore, have not been considered in this plan.
Changes since 2020 Infrastructure Plan
In 2020, the Infrastructure Plan identified unfunded capital needs at $5.8 billion. Four years later, the City’s infrastructure deficit has seen a net increase of $2.3 billion, mainly attributed to:
- An expanded scope that now includes programs and other commitments (above the $5M threshold)
- Newly identified investment needs added
- Project cost estimate revisions and refinement since 2020
- Previously unfunded projects receiving capital budget approvals, investments that were re-assessed or have been identified beyond 2033
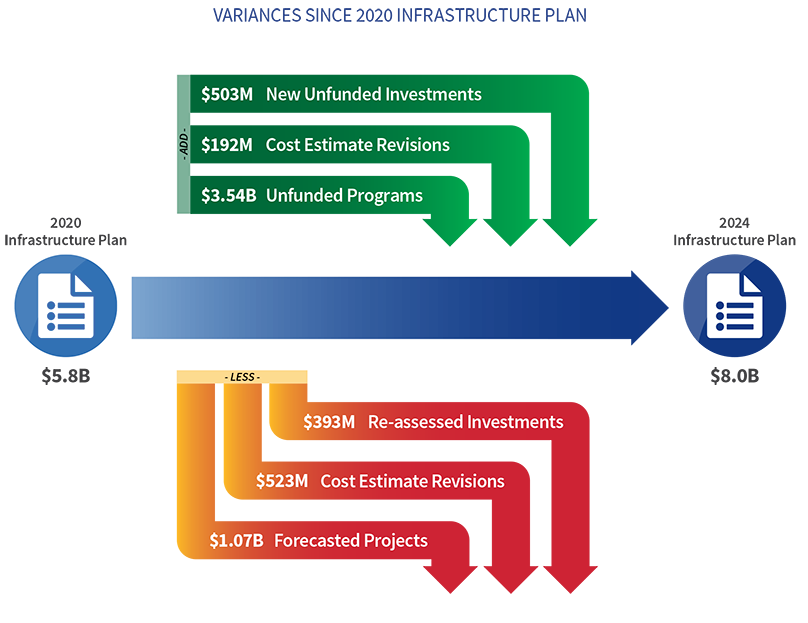
Figure 10: Changes since 2020 Infrastructure Plan
Infographic for the variances since 2020 Infrastructure Plan.
Graphic presents the total capital investment needs captured by the 2020 Infrastructure plan as $5.8 billion, and the 2024 Infrastructure plan at $8.0 billion.
Additions to the 2020 plan that can be found in the 2024 plan include:
- $503 million New Unfunded Investments
- $192 million Cost Estimate Revisions
- $3.54 billion Unfunded Programs
Subtractions from the 2020 infrastructure plan that are not represented in the 2024 Infrastructure plan include:
- $393 million Re-assessed Investments
- $523 million Cost Estimate Revisions
- $1.07 billion Forecasted Projects
Since the 2020 Infrastructure Plan, Council approved significant capital funding towards the City’s top priorities identified in the plan. Three projects have been completed and 12 projects which were previously unfunded are now forecasted in the 2024 budget. This equates to just over $1B in strategic investments across a multitude of services.
Investments with approved budgets and not present in the 2024 Infrastructure Plan
- North End Sewage Treatment plant (NEWPCC) Upgrades: Biosolids
- Boni-Vital Pool
- St. James Civic Centre - Facility Expansion
Investments forecasted for approval in the 2024 budget
- Water Meter Renewals
- Bus Radio and Intelligent Transportation System (ITS) Replacement
- North Garage Replacement
- Southwest Interceptor River Crossing
- St Vital Bridge Rehabilitation
- Pembina Hwy Overpass Rehabilitation at Abinojii Mikanah
- Facility Optimization - Waverley West Station
- Lagimodiere Twin Overpasses Rehabilitation (Concordia & CPR Keewatin)
- Silver Heights Fire Paramedic Station
The transition from an ‘unfunded’ status on the Infrastructure Plan into the approved Capital Budget demonstrates that the Infrastructure Plan has supported the decision-making process and contributed to moving the City closer to achieving its overall strategic goals.
Interactive Infrastructure Plan
Using feedback received from internal and external stakeholders, a number of improvements have been made to facilitate access to data, increase transparency and illustrate alignment to key priorities. This has mainly been accomplished through the development of an interactive Infrastructure Plan allowing users to navigate through various departments, services and strategies.
When users first access the interactive Infrastructure Plan, the financial period and funding category and will default to the “10 year Capital Plan” and “10-year investment needs” as this will provide a quick, overall view of the City needs.
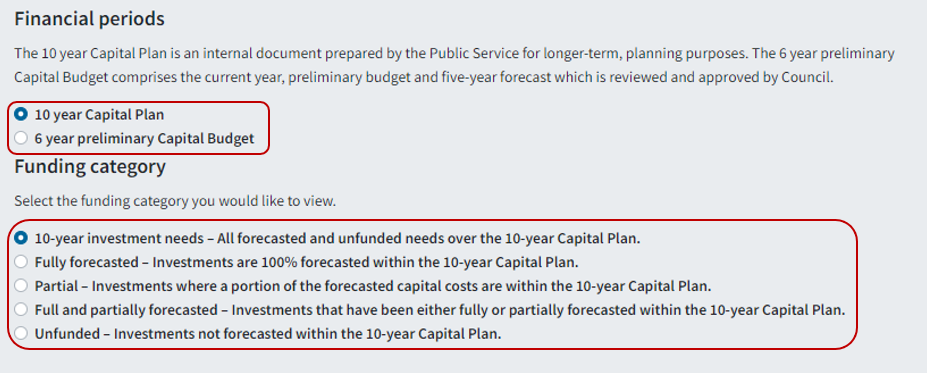
Figure 11: Interactive Infrastructure Plan selection panel
Screenshot of the opening Interactive Infrastructure Plan selection of the Infrastructure Plan dashboard. Top section allows user to select one of the following financial periods:
- 10 year Capital Plan where the 10 year Capital Plan is an internal document prepared by the Public Service for longer-term, planning purposes.
- 6 year preliminary Capital Budget where the 6 year preliminary Capital Budget comprises the current year, preliminary budget and five-year forecast which is reviewed and approved by Council.
Funding category selection is below where users are asked to select the funding category you would like to view. Selections include:
- 10-year investment needs, defined as all forecasted and unfunded needs over the 10-year Capital Plan.
- Fully forecasted defined as investments are 100% forecasted within the 10-year Capital Plan.
- Partial defined as investments where a portion of the forecasted capital costs are within the 10-year Capital Plan.
- Full and partially forecasted defined as investments that have been either fully or partially forecasted within the 10-year Capital Plan.
- Unfunded defined as investments not forecasted within the 10-year Capital Plan.
The 10-year Capital Plan is an internal document prepared by the Public Service for longer-term, planning purposes. The 6-year preliminary Capital Budget comprises the current year, preliminary budget and five-year forecast which is reviewed and approved by Council.
The 10-year view also coincides with best practices in reporting asset information. In particular, the infrastructure deficit.
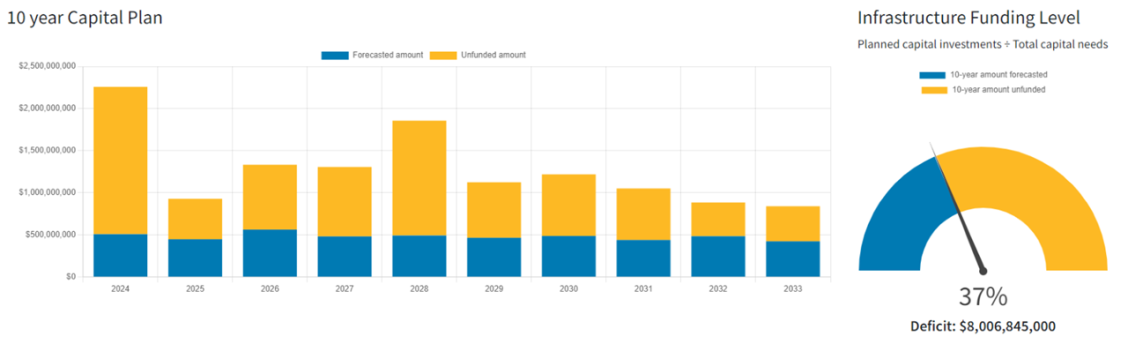
Figure 12: Interactive Infrastructure Plan10-year Capital Plan view
Screenshot of the Interactive Infrastructure Plan 10-year capital plan view. Includes a bar chart of the 10-year capital plan forecasted and unfunded amounts with an infrastructure funding level speedometer beside.
The stacked bar chart shows blue forecasted amounts steady at around $500 million over the 10-year period, with yellow unfunded portions on top of the blue. The yellow unfunded portions fluctuate over the 10-year period. 2024 shows the highest unfunded amount at close to $1.8 billion making the stacked bar for 2024 at approximately $2.3 billion. 2028 year also shows an increase in needs with the stacked bar at approximately $1.8 billion. The remaining years stacked bars hover just over or just under $1 billion.
The infrastructure funding level speedometer to the right of the bar chart shows planned capital investments divided by total capital needs. This calculates to 37% 10-year amount forecasted, and the remainder 10-year amount unfunded for a deficit of $8,006,845,000.
Various other aggregate options are available to help filter information and provide users with addition access to data.
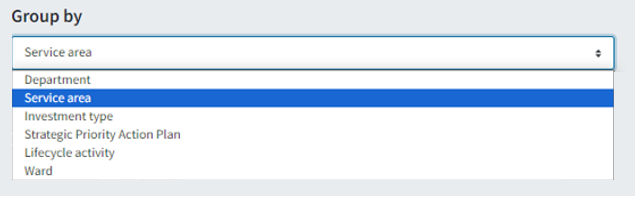
Figure 13: Group by categories
Screenshot from the Interactive Infrastructure Plan displaying the options users may select to group the data by. Group by options include:
- Department
- Service area
- Investment type
- Strategic Priority Action Plan
- Lifecycle activity
- Ward
Where Service area is the default selection on the Interactive Infrastructure Plan.
Once information is sorted and displayed, a user can click on a specific project/program to obtain additional details or simply hover over certain charts to see how costs are broken down. For instance, Figure 14 shows the cost breakdown of the total forecasted and unfunded needs for 2024.
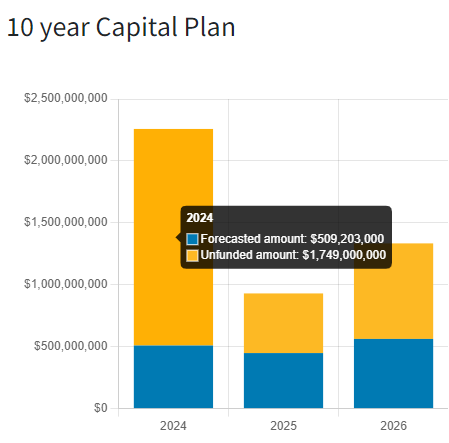
Figure 14: Breakdown of needs
Screenshot from the Interactive Infrastructure Plan showing the ability for the user to hover over the bars in the stacked bar chart in the 10-year capital plan and see the year, and a legend. The legend shows with the blue forecasted amount and the yellow unfunded amount, including the dollar value for each.
In addition to this feature, where possible, investments have also been populated into a map view to help identify where specific forecasted, partial or unfunded investments fall geographically. This is particularly useful when associating investments with other key areas of interest that can be selected within the “map layer”.
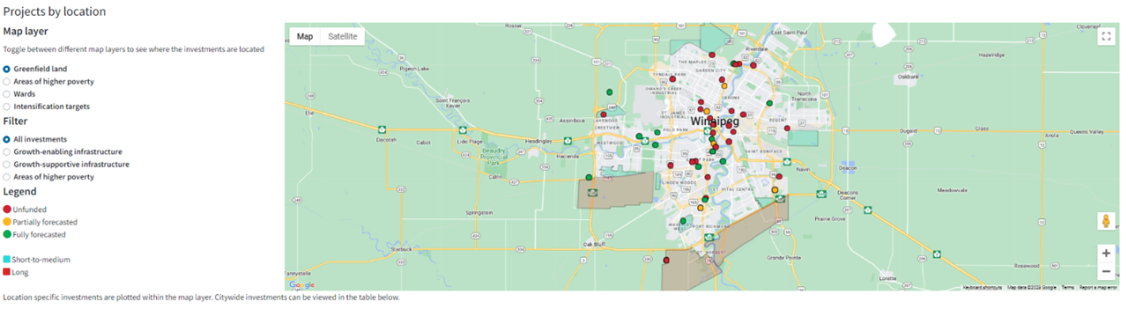
Figure 15: Interactive Infrastructure Plan map view
A preview of the interactive infrastructure plans map view. The left portion of the screen presents a legend panel describing all map layers, available filters, and a legend of the data contained in the map.
Map Layers include:
- Greenfield Land
- Areas of Higher Poverty
- Wards
- Infrastructure Targets
The Panel contains a series of filters that can be applied to the data to limit the data presented on the map. Options to Filter investments include:
- All Investments
- Growth-Enabling Infrastructure
- Growth-Supportive Infrastructure
- Areas of Higher Poverty
The legend portion of the panel describes:
- Investment types
- Unfunded Investments
- Partially Forecasted Investments
- Forecasted Investments
- Greenfield Land Development Phase
- Short-to-Medium
- Long
Selecting a map point investment or an investment title within the list option will provide users with greater financial details of the investments, their alignment to specific strategies such as the Strategic Priority Action Plan and Poverty Reduction Strategy, as well as the investment type and lifecycle activity.
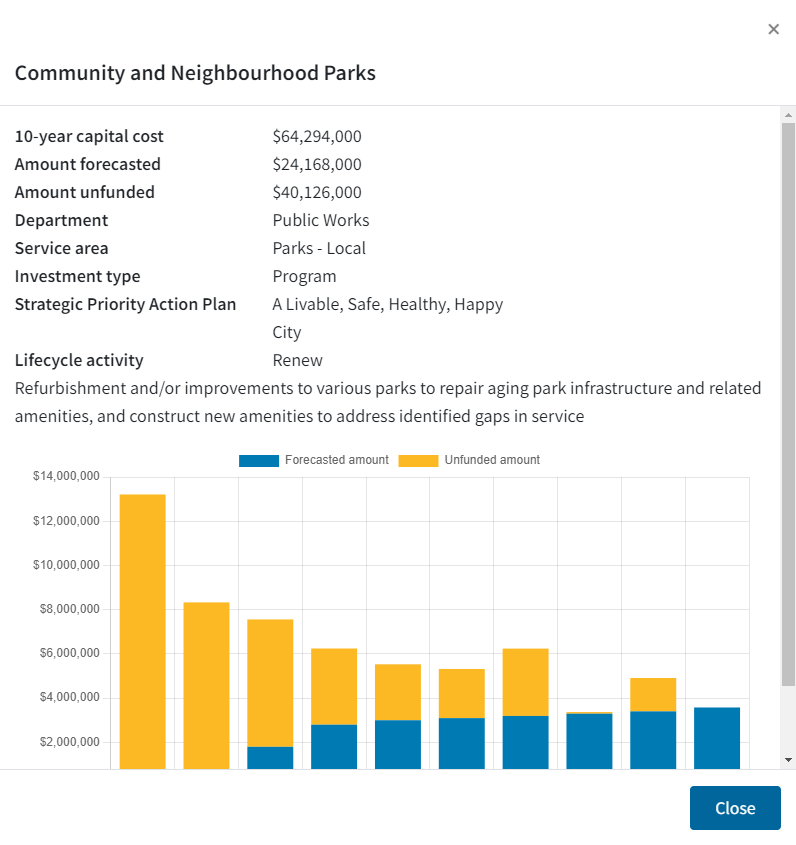
Figure 16: Map point investment details
From the Interactive Infrastructure Plan, an example of the project details page. Example presented is the Community and Neighborhood Parks program.
Details presented include:
- 10-year capital cost: $64,294,000
- Amount Forecasted: $24,168,000
- Amount Unfunded: $40,126,000
- Department: Public Works
- Service Area: Parks – Local
- Investment Type: Program
- Strategic Priority Action Plan: A Livable, Safe, Healthy, Happy City
- Lifecycle Activity: Renew
Program Description: Refurbishment and/or improvements to various parks and repair aging park infrastructure and related amenities and construct new amenities to address identified gaps in service.
Barchart along the bottom presents the highest unfunded needs are in the years 2024, and this decreases from 2026 to 2032. Forecasted funds increase from the year 2026 to 2033.
Summary
Departments across all service areas provided the necessary inputs used to evaluate the merits of these capital investments along with the expected usage of the asset once projects have been completed and placed into service. The projects and programs within the Infrastructure Plan are presented in ranked order within their service area. The Infrastructure Plan is meant to serve as a tool that promotes cross-departmental discussions and enhances decision-making on overall City priorities.
The following chart summarizes the total unfunded capital needs by department and service from 2024-2033.
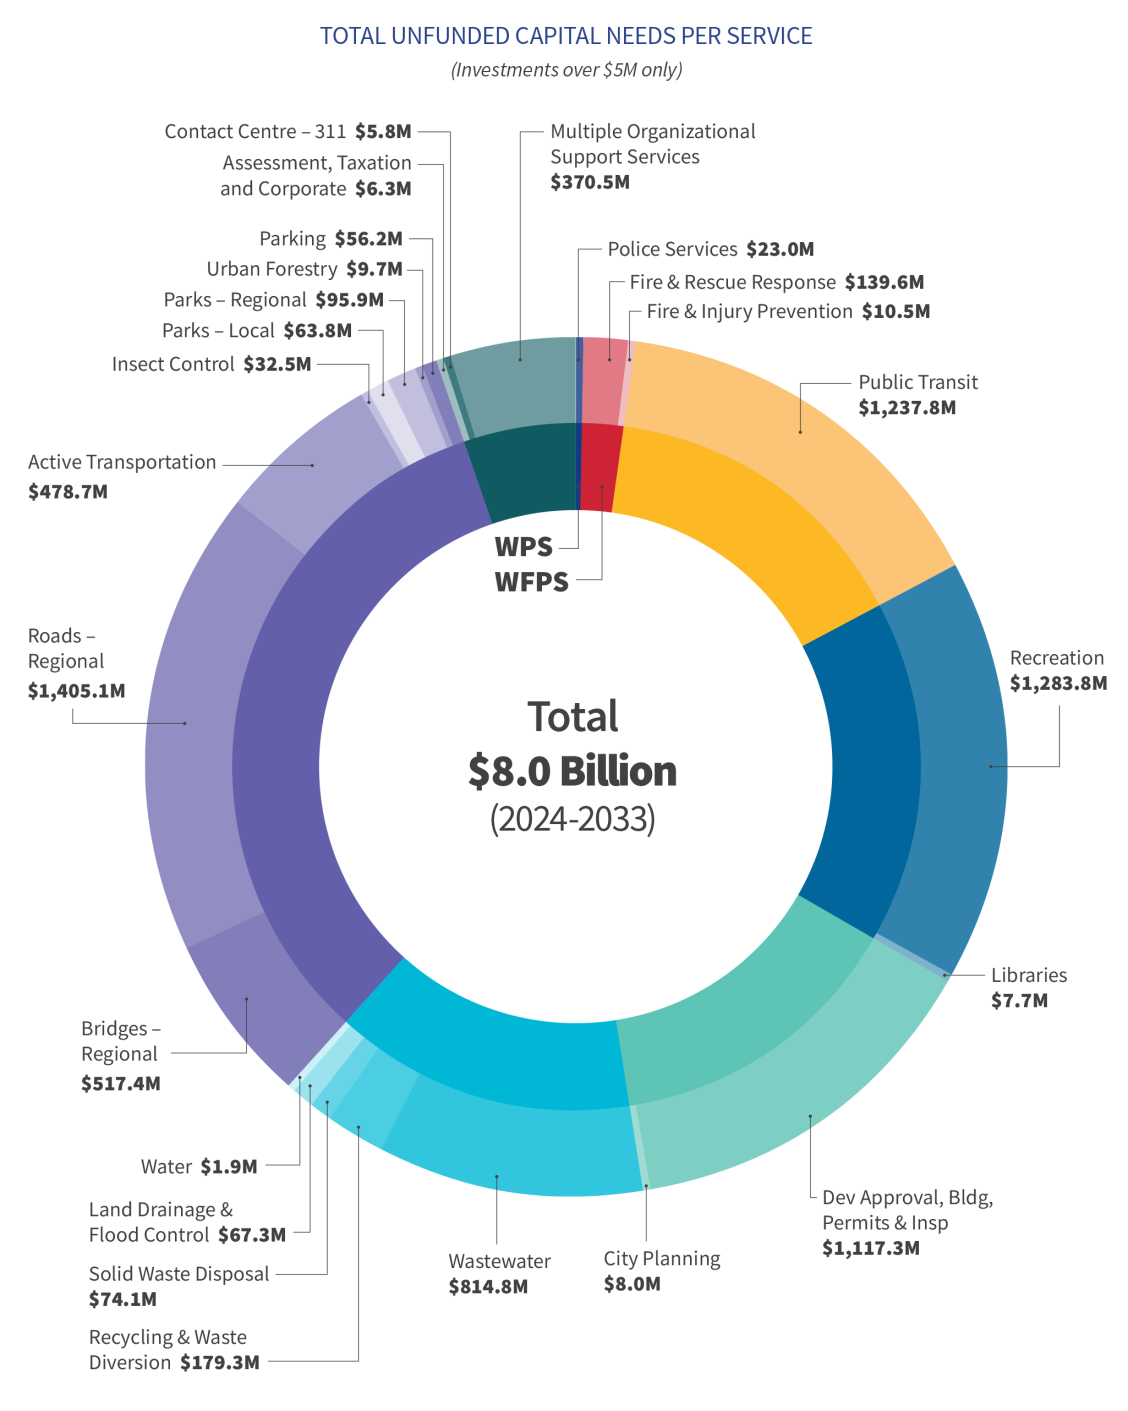
Figure 17: Total capital needs per service
Total city unfunded capital needs for the 2024-2033 period: $8.0 Billion
A double donut chart that articulates the total capital needs by service area, while grouped by department.
- Public Works
- Bridges Regional - $517.4M
- Roads – Regional - $1,405.1M
- Active Transportation - $478.7M
- Insect Control -$32.5M
- Parks – Local - $63.8M
- Parks - Regional $95.9M
- Urban forestry - $9.7M
- Parking - $56.2M
- Winnipeg Police Service
- Police Services - $23.0M
- Winnipeg Fire Paramedic Service
- Fire & Rescue Response - $139.6M
- Fire & Injury Prevention - $10.5M
- Transit
- Public Transit – $1,237.8M
- Community Services
- Recreation - $1,283M
- Libraries - $7.7M
- PPD
- Dev Approval, Bldg, Permits & Inspection - $1,177.3 M
- City Planning - $8.0M
- Water & Waste
- Wastewater - $814.8M
- Recycling & Waste Diversion - $179.3M
- Solid Waste Disposal - $74.1M
- Land Drainage & Flood Control - $67.3M
- Water - $1.9M
- Other
- Contact Centre – 311 - $5.8M
- Assessment, Taxation and Corporate - $6.3
- Multiple Organizational Support Services - $370.5M