
June 2023
Provided by Prairie Research Associates

Background and Objectives
Background
- Historically, this study has been used as a tool for measuring the level of satisfaction of the citizens of Winnipeg.
- The City of Winnipeg has conducted this study annually since 2001 (three years missed – 2005, 2006, and 2008).
Objectives
- Determine Winnipeg citizen’s levels of satisfaction regarding their city
- Determine Winnipeg citizen’s current needs in their city
- Gauge how those needs have changed and where they are heading
e.g. Are specific issues trending downward or emerging?
- Gauge how those needs have changed and where they are heading
Methodology
A total of 600 Winnipeg citizens aged 18 years and over were interviewed by telephone between May 1 to May 17, 2023. The sample include both landlines and cell phone numbers. The final results in this survey are weighted by age, gender, and income of Winnipeg respondents according to 2022 Statistics Canada census data.
The margin-of-error for this telephone survey of 600 adults is +/- 4.0%, 19 times out of 20. The margin-of-error is higher for sub-populations analyzed in these results.
Where applicable, this report compares the results of the 2023 survey with the results of previous citizen satisfaction surveys conducted in 2019 to 2022.
Notes:
- Data presented is based on people who answered the survey questions (excludes “don’t know/refused” response).
- The percentages shown in this report may not add up to exactly 100%, due to rounding.
- Values less than 3% may not be shown in charts.
Demographics
The majority of respondents are under 55 years old and nearly four-in-five are home owners.
Age
Question 73 -- What age are you? (Base: All respondents (excluding Refused). 2023 n=599) - unweighted
| Age | Percent |
|---|---|
| 65 and older | 21% |
| 55 to 64 | 14% |
| 45 to 54 | 22% |
| 35 to 44 | 15% |
| 25 to 34 | 20% |
| 18 to 24 | 7% |
Own/Rent Home
Question 74 -- Do you rent or own your home? (Base: All respondents (excluding Don’t know/Refused). 2023 n=585) - unweighted
| Own or Rent | Percent |
|---|---|
| Rent | 21% |
| Own | 79% |
Level of Education
The majority of respondents have some post-secondary education with 50% having a university degree. Of the 76% of residents who answered the income question, about 7 in 10 have a household income of $60,000 or more.
Question 75 -- What is the highest level of education you have completed? (Base: All respondents (excluding Don’t know/Refused). 2023 n=589) - unweighted
| Level of Education | Percent |
|---|---|
| University degree(s) | 50% |
| Community college/technical | 26% |
| Completed high school | 20% |
| Less than high school | 4% |
Household Income
Question 76 -- Total household income before taxes. (Base: All respondents (excluding Don’t know/Refused). 2023 n=456) - unweighted
| Income | Percent |
|---|---|
| $150K+ | 15% |
| $100K to $150k | 20% |
| $80K to <$100K | 15% |
| $60K to <$80K | 19% |
| $30K to <$60K | 22% |
| <$30K | 10% |
Where do they live?
Question 78 -- First three characters of postal code. (Base: All respondents (excluding Don’t know/Refused). 2023 n=597) – unweighted
| Quadrant | Percent |
|---|---|
| Downtown | 11% |
| West/Southwest | 34% |
| North | 16% |
| East/Southeast | 39% |
| Inner or outer city | Percent |
|---|---|
| Inner City | 25% |
| Outer City | 75% |
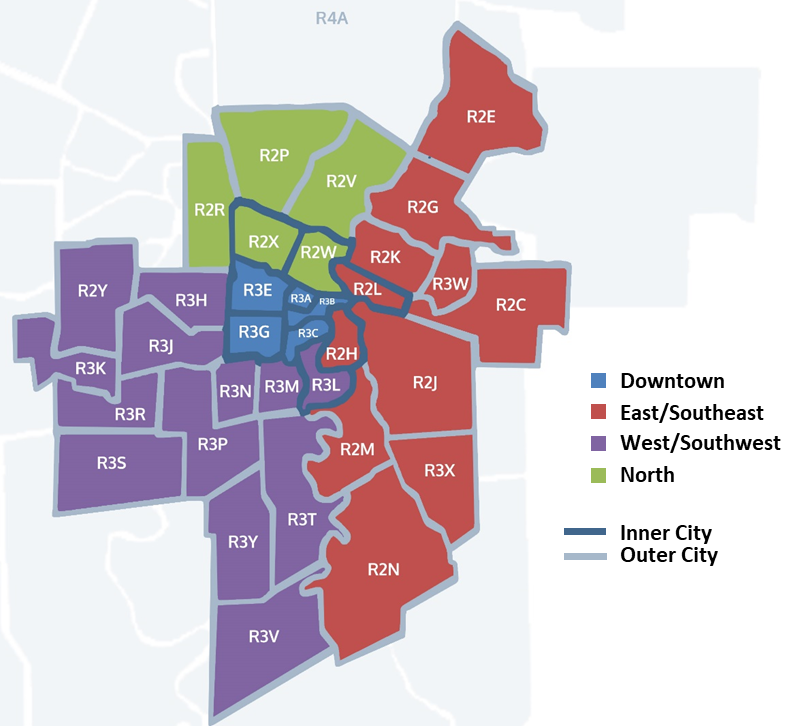
Map of Winnipeg divided by postal code areas using colours to show four quadrants: Downtown, East/Southeast, West/Southwest, and North. The map also has a dark blue line around inner city postal code areas (R2X, R2W, R3E, R3A, R3B, R3C, R3G, R2L, R2H, and R3L) and a light blue line around the other postal code areas to show the outer city.
Ethnic Origin
Groupings are similar to those used by Statistics Canada. In the report, those identified as visible minority are those who identify as having a background other than only white/Caucasian.
Question 77 -- How would you describe your ethnic background? Multiple responses allowed (Base: All respondents (excluding Don’t know/Refused). 2023 n=577) -- unweighted
| Ethnic origin | Percent |
|---|---|
| White/Caucasian (e.g., European) | 74% |
| Indigenous or Aboriginal | 10% |
| South Asian (e.g., East Indian, Pakistani) | 4% |
| Filipino | 4% |
| Black (e.g., African) | 3% |
| Southeast Asian (e.g., Vietnamese) | 2% |
| Latin American | 2% |
| Chinese | 1% |
| Arab (e.g., Saudi, Egyptian) | 1% |
| West Asian (e.g., Iranian) | <1% |
| Other | 2% |
Results
2023 Overall Satisfaction
Quality of Life (Very good/Good)
| Year | Percent |
|---|---|
| 2019 | 93% |
| 2020 | 97% |
| 2021 | 89% |
| 2022 | 88% |
| 2023 | 84% |
Value for Tax Dollars (Very good/Good)
| Year | Percent |
|---|---|
| 2019 | 68% |
| 2020 | 78% |
| 2021 | 64% |
| 2022 | 59% |
| 2023 | 59% |
Customer Service (Very /Somewhat Satisfied)
| Year | Percent |
|---|---|
| 2019 | 81% |
| 2020 | 82% |
| 2021 | 78% |
| 2022 | 73% |
| 2023 | 72% |
Overall City Services (Very /Somewhat Satisfied)
| Year | Percent |
|---|---|
| 2019 | 88% |
| 2020 | 90% |
| 2021 | 87% |
| 2022 | 81% |
| 2023 | 80% |
Net Promoter Score Value
21% are classified as Winnipeg Promoters, and the overall 2023 Net Promoter Score is -15. This is a 1-point decrease compared to 2022 and is similar to 2022 where detractors are higher than promoters. Older citizens are more likely to be Promoters.
NET Promoter Score (NPS) is calculated by subtracting the Detractor score from the Promoter score (% Promoters - % Detractors)
Question 2 -- On a scale from 0 to 10, where 0 is not at all likely and 10 is very likely, how likely would you be to recommend Winnipeg as a place to live? (Base: All respondents (excluding Don’t know/Refused). 2023 n=598)
Likelihood of Recommending Winnipeg as a Place to Live
| Year | Net Promoter Score | Promoters (9-10 out of 10) | Passives (7-8 out of 10) | Detractors (0-6 out of 10) |
|---|---|---|---|---|
| 2019 | +11 | 32% | 47% | 21% |
| 2020 | +17 | 36% | 45% | 19% |
| 2021 | +1 | 27% | 47% | 26% |
| 2022 | -14 | 21% | 45% | 35% |
| 2023 | -15 | 21% | 43% | 36% |
Quality of Life
Similar to the last time this was asked, the majority (84%) of Winnipeggers rate the overall quality of life in Winnipeg as very good or good.
Overall quality of life in Winnipeg today
Question 3 -- In general, how would you consider the overall quality of life in Winnipeg today? (Base: All respondents (excluding Don’t know/Refused). 2023 n=591
| Year | Net very Good/Good | Very good | Good | Poor | Very poor |
|---|---|---|---|---|---|
| 2019 | 93% | 24% | 69% | 6% | 1% |
| 2020 | 97% | 40% | 56% | 3% | 1% |
| 2021 | 89% | 23% | 66% | 9% | 3% |
| 2022 | 88% | 20% | 69% | 10% | 2% |
| 2023 | 84% | 18% | 66% | 14% | 2% |
Quality of Life Statements
Question 4 to Question 9 -- I am now going to read you a few statements about your perception of Winnipeg. For each one, please tell me whether you strongly agree, agree, disagree, or strongly disagree. (Base: All respondents (excluding Don’t know/Refused). 2023 n=496-598
Easy to get around by car
| Year | Percent who responded Strongly agree/Agree |
|---|---|
| 2019 | 87% |
| 2020 | 94% |
| 2021 | 91% |
| 2022 | 88% |
| 2023 | 89% |
Easy to get around by walking
| Year | Percent who responded Strongly agree/Agree |
|---|---|
| 2019 | 74% |
| 2020 | 80% |
| 2021 | 77% |
| 2022 | 72% |
| 2023 | 67% |
Feel safe walking alone at night in neighbourhood
| Year | Percent who responded Strongly agree/Agree |
|---|---|
| 2019 | 64% |
| 2020 | 68% |
| 2021 | 66% |
| 2022 | 66% |
| 2023 | 60% |
Note: In 2023, 73% those who identified as male and 65% of outer city residents felt safe walking alone at night in their neighborhood (higher than average).
Easy to get around by bicycle
| Year | Percent who responded Strongly agree/Agree |
|---|---|
| 2019 | 58% |
| 2020 | 64% |
| 2021 | 66% |
| 2022 | 63% |
| 2023 | 58% |
Easy to get around by transit
| Year | Percent who responded Strongly agree/Agree |
|---|---|
| 2019 | 61% |
| 2020 | 64% |
| 2021 | 62% |
| 2022 | 61% |
| 2023 | 56% |
Feel safe walking alone at night downtown
| Year | Percent who responded Strongly agree/Agree |
|---|---|
| 2019 | 14% |
| 2020 | 18% |
| 2021 | 14% |
| 2022 | 14% |
| 2023 | 10% |
Note: In 2023, 82% of those who identified as female strongly disagreed that they feel safe walking alone at night downtown (higher than average).
Perceptions of Winnipeg Statements
Question 10 to Question 12 -- I am now going to read you a few statements about your perception of Winnipeg. For each one, please tell me whether you strongly agree, agree, disagree, or strongly disagree. (Base: All respondents (excluding Don’t know/Refused). 2023 n=522-582
I can find the information I need on the City of Winnipeg website
| Year | Percent who responded Strongly agree/Agree |
|---|---|
| 2023 | 79% |
| 2022 | 82% |
| 2021 | 85% |
| 2020 | 88% |
Note: In 2023, 97% of those who identified as a visible minority strongly agreed or agreed that they can find the information they need on the City of Winnipeg website (higher than average); 55% of those whose household income is $30,000 or less strongly agreed or agreed that they can find the information they need on the City of Winnipeg website (lower than average).
I believe the City of Winnipeg acts in the best interest of citizens
| Year | Percent who responded Strongly agree/Agree |
|---|---|
| 2023 | 61% |
| 2022 | 66% |
| 2021 | 71% |
| 2020 | 82% |
Note: In 2023, 46% of those who rent strongly agreed or agreed that they believe the City of Winnipeg acts in the best interest of its citizens (lower than average).
Believe that I can influence the decisions or direction of the City of Winnipeg
| Year | Percent who responded Strongly agree/Agree |
|---|---|
| 2023 | 40% |
| 2022 | 42% |
| 2021 | 43% |
| 2020 | 52% |
Question 12A to Question 12C -- I am now going to read you a few statements about your perception of Winnipeg. For each one, please tell me whether you strongly agree, agree, disagree, or strongly disagree. (Base: All respondents (excluding Don’t know/Refused). 2023 n=532-562).
I find the City of Winnipeg to be a trustworthy source of information
| Year | Percent who responded Strongly agree/Agree |
|---|---|
| 2023 | 83% |
| 2022 | 83% |
| 2021 | 87% |
Note: In 2023, 40% of those who identified as a visible minority strongly agreed (higher than average) and 80% of those who identified as Caucasian strongly agreed or agreed (lower than average).
I believe the City of Winnipeg's actions towards reconciliation with Indigenous peoples are making a positive impact
| Year | Percent who responded Strongly agree/Agree |
|---|---|
| 2023 | 68% |
| 2022 | 71% |
| 2021 | 70% |
I believe the City of Winnipeg is doing enough for residents who are experiencing homelessness.
| Year | Percent who responded Strongly agree/Agree |
|---|---|
| 2023 | 25% |
| 2022 | 24% |
Note: In 2023, 41% those who identified as a visible minority strongly agreed or agreed that the City of Winnipeg is doing enough for residents who are experiencing homelessness.
Actions to Improve Quality of Life
Citizens most commonly mentioned roads and infrastructure for improving the quality of life in Winnipeg. This has gone down since 2022. Crime and policing has more than doubled since 2022 and a small increase is seen with housing /social programs. However, other responses remain fairly similar.
Question 13 -- What actions do you think the City of Winnipeg could take to improve the quality of life in the City? (accept up to 3 answers) (Base: All respondents (excluding Don’t know/Refused). 2023 n=525)
| Action to improve quality of life | 2023 | 2022 | 2021 | 2020 | 2019 |
|---|---|---|---|---|---|
| Roads / Infrastructure | 36% | 58% | 23% | 29% | 24% |
| Crime / Policing | 33% | 14% | 23% | 24% | 51% |
| Housing / Social programs | 30% | 23% | 24% | 15% | 6% |
| Improve services | 19% | 23% | 22% | 26% | 0% |
| Active living / Transit | 17% | 17% | 20% | 21% | 20% |
| Economy | 12% | 11% | 8% | 11% | 5% |
| City Planning | 11% | 8% | 10% | 10% | 6% |
| All Others | 18% | 18% | 22% | 17% | 11% |
| Nothing | <1% | 1% | 2% | 4% | 5% |
Top Actions by perceived Quality of Life
Question 13 -- What actions do you think the City of Winnipeg could take to improve the quality of life in the City? (accept up to 3 answers) (Base: All respondents (excluding Don’t know/Refused). 2023 n=525)
| Action | Very good/Good (84%, n=496) | Very Poor/Poor (16%, n=95) |
|---|---|---|
| Roads / Infrastructure | 38% | 30% |
| Housing/social programs | 29% | 35% |
| Improve services | 20% | 18% |
| Active living / Transit | 20% | 5% |
| Crime / Policing | 32% | 36% |
| Economy | 9% | 26% |
| City Planning | 9% | 17% |
Most common actions for Good/Very good (84%, n=496)
- Fix roads and streets, including back lanes (35%)
- Reduce crime / improve law enforcement / safety (20%)
- Address homelessness (19%)
Most common actions for Very poor/Poor (16%, n=95)
- Address homelessness (26%)
- Fix roads and streets, including back lanes (24%)
- Reduce cost of living / raise minimum wage / increase wages (18%)
- Reduce crime / improve law enforcement / safety (16%)
Selected verbatims for Good/Very good (84%)
- “To make the roads better. To make life better.”
- “To decrease crime and homelessness - especially in the downtown area.”
- “The infrastructure. Make downtown safer. More social housing.”
- “Safety and poverty are the biggest issues. People don't feel like they can venture out alone, or not alone. Some areas are not very safe.”
- “Roads really need consistent maintenance and more green space and cleaning current green spaces way more often.”
- “Reduce crime. Homelessness.”
- “Potholes.”
- “Improve the roads throughout the city, and province. Deal with homeless, and the crime.”
“Address homelessness, safe injection sites, crime in general.”
Selected verbatims for Very poor/Poor (16%)
- “Unsafe. Clean up slum core area.”
- “The quality of life. Police not responding. Roads not that good. Safety is a concern.”
- “Reduce taxes and cost of living.”
- “Lower crime rates. The healthcare is the pits, and needs to be improved. Lower the price of groceries. Better winter maintenance of sidewalks.”
- “Fix the roads and the homelessness.”
Value for Tax Dollars
About three in five of Winnipeggers feel that they receive good or very good value for their property tax dollars.
Question 14 -- Considering the services provided by the City for your property tax dollars, do you feel you receive… (Base: All respondents (excluding Don’t know/Refused). 2023 n=552)
| Year | Percent who answered Very good/ Good value | Very good value | Good value | Poor value | Very poor value |
|---|---|---|---|---|---|
| 2019 | 68% | 5% | 63% | 28% | 4% |
| 2020 | 78% | 8% | 70% | 19% | 3% |
| 2021 | 64% | 7% | 58% | 28% | 8% |
| 2022 | 59% | 4% | 55% | 33% | 8% |
| 2023 | 59% | 4% | 55% | 31% | 10% |
Question 14B -- Why do you feel you receive <<Question 14.text>> from your property tax dollars? Multiple response allowed. (Base: Gave an option about value for taxes (excluding Don’t know/Refused). 2023 n=431)
| Reason | Very good/good value (59%, n=328) | Very poor/poor value (41%, n=224) |
|---|---|---|
| City Planning/Spending | 53% | 38% |
| Services | 46% | 45% |
| Roads/Infrastructure | 14% | 48% |
| Safety/Policing | 9% | 8% |
| Other | 15% | 20% |
Most common reasons for very good/good value (59%, n=328)
- General satisfaction (36%)
- Satisfaction with services:
- Snow clearing (16%)
- Garbage/recycling (14%)
- Satisfaction with road upkeep (10%)
Most common reasons for very poor/poor value (41%, n=224)
- Dissatisfaction with roads (39%)
- General dissatisfaction with spending (16%)
- Dissatisfaction with services (14%)
- Dissatisfaction with taxes (13%)
- Dissatisfaction with snow removal (12%)
- Dissatisfaction with city administration and planning (11%)
- Dissatisfaction with community services (11%)
Selected verbatims for very good/good value (59%)
- “When things are going good, it's hard to pinpoint bad things.”
- “The services that I receive through the city are adequate i.e., garbage collection & plowing of streets and sidewalks.”
- “Streets gets fixed; water main break gets fixed; problems are dealt with; I can talk to my councillors on a regular basis.”
- “Roads are in overall good condition. Snow clearing on time.”
- “Infrastructure - I have never had problems with my water or the power lines and few potholes in my neighborhood.”
- “I don’t feel overtaxed and mostly feel that services are adequate.”
Selected verbatims for very poor/poor value (41%)
- “There's potholes everywhere on residential streets - it's terrible! Fix them!”
- “The streets are not cleaned promptly. The sidewalk still have a ton of dust, and sand. The streets lack plowing after snowfall, or it is too slow after snowfall. Reporting incidents requires an address when reporting to the city on 311. It’s random things rubbing me the wrong way with the city. It seems a common sense approach is needed for the city to live efficiently. It’s the availability of lessons, and being able to register. More slots are needed for leisure guide programs. Ways places are built limit street parking in my area. They only cut the weeds once every year in my area. I don't like the train going through the city. It is very noisy and a hazard that could pose a risk of derailment or explosion. The city could be more proactive.”
- “Taxes are okay but you don't get good value from what you're paying (poor road condition).”
- “Snow clearing is not done regularly and we always exceed the budget by December every year. Street sweeping takes a long time that it is still not done in my neighborhood.”
- “Frontage tax unfair, school tax unfair, hate subsidizing millionaires’ hockey team, roads awful, sewage still being released into river, waste of money on rapid transit which is vastly underused and unnecessary and dangerous.”
Customer Service
Contact with the City
Phone is the most common method used to contact the City followed by email. About 3 in 5 Winnipeggers contacted the city in the past year, with those over the age of 34 and homeowners being more likely to do so.
Question 65 -- Have you contacted 311 or another staff member from the City of Winnipeg in the last year? (Base: All respondents (excluding Don’t know/Refused). 2023 n=596)
Contact with the City in the last year
| Year | Percent who responded Strongly agree/Agree |
|---|---|
| 2023 | 60% |
| 2022 | 58% |
| 2021 | 55% |
| 2020 | 63% |
| 2019 | 67% |
Note: In 2023, 67% of those who own a home had contacted the City in the last year (higher than average) and 47% of those from 18 to 34 years old had contacted the City in the last year (lower than average).
Question 66 -- How did you contact the City of Winnipeg? Multiple responses allowed (Base: Contacted the city (excluding Don’t know/Refused). 2023 n=359)
| Year | Percentage who contacted the City by phone |
|---|---|
| 2023 | 84% |
| 2022 | 82% |
| 2021 | 85% |
| 2020 | 87% |
| 2019 | 89% |
| Year | Percentage who contacted the City by email |
|---|---|
| 2023 | 22% |
| 2022 | 18% |
| 2021 | 17% |
| 2020 | 14% |
| 2019 | 18% |
| Year | Percentage who contacted the City by completing the form online |
|---|---|
| 2023 | 15% |
| 2022 | 12% |
| 2021 | 7% |
| 2020 | 9% |
| 2019 | 12% |
| Year | Percentage who contacted the City in person |
|---|---|
| 2023 | 3% |
| 2022 | 4% |
| 2021 | 2% |
| 2020 | 2% |
| 2019 | 6% |
| Year | Percentage who contacted the City through social media |
|---|---|
| 2023 | 3% |
| 2022 | 3% |
| 2021 | 4% |
| 2020 | 3% |
| 2019 | 2% |
| Year | Percentage who contacted the City by mail |
|---|---|
| 2023 | 2% |
| 2022 | 1% |
| 2021 | 1% |
| 2020 | 1% |
| 2019 | 2% |
Satisfaction with Customer Service
Similar to last year, satisfaction with customer service remains high at 72%. Satisfaction is highest by telephone.
Question 67 -- How would you rate the experience? (Base: Contacted the city (excluding Don’t know/Refused). 2023 n=356)
| Year | Percent who answered Very/somewhat satisfied | Very satisfied | Somewhat satisfied | Somewhat dissatisfied | Very dissatisfied |
|---|---|---|---|---|---|
| 2019 | 81% | 40% | 42% | 11% | 7% |
| 2020 | 82% | 46% | 37% | 10% | 7% |
| 2021 | 78% | 44% | 34% | 13% | 9% |
| 2022 | 73% | 35% | 38% | 15% | 12% |
| 2023 | 72% | 33% | 39% | 11% | 17% |
There are no demographic subgroups more likely to be satisfied with the customer service experience.
| Method of contact | Percentage of Very/ Somewhat satisfied |
|---|---|
Phone | 71% |
73% | |
Online | 72% |
Customer Service Details
Question 68 to Question 71 -- I am going to read you a number of statements about the City. Thinking about your personal dealings with the City of Winnipeg and your general impressions, please tell me whether you strongly agree, somewhat agree, somewhat disagree, or strongly disagree. (Base: Contacted the city (excluding Don’t know/Refused). 2023 n=348-353)
| City staff are courteous, helpful and knowledgeable | Percent who responded Strongly/somewhat agree |
|---|---|
| 2023 | 87% |
| 2022 | 90% |
| 2021 | 92% |
| 2020 | 94% |
| 2019 | 91% |
| The quality of service from the City is consistently high | Percent who responded Strongly/somewhat agree |
|---|---|
| 2023 | 66% |
| 2022 | 66% |
| 2021 | 76% |
| 2020 | 78% |
| 2019 | 73% |
| The City responds quickly to requests and concerns | Percent who responded Strongly/somewhat agree |
|---|---|
| 2023 | 53% |
| 2022 | 51% |
| 2021 | 67% |
| 2020 | 65% |
| 2019 | 59% |
| City staff are easy to get a hold of when I need them | Percent who responded Strongly/somewhat agree |
|---|---|
| 2023 | 52% |
| 2022 | 49% |
| 2021 | 61% |
| 2020 | 59% |
| 2019 | 62% |
Improvement to Customer Service
Customers service improvements by satisfaction level
| Suggested Improvement | Very/Somewhat satisfied (72%, n=257) | Very/Somewhat dissatisfied (28%, n=100) |
|---|---|---|
| Staffing Levels/Availability | 38% | 61% |
| Staff contact | 30% | 47% |
| Systems | 10% | 18% |
| Other | 3% | 3% |
| No suggestions/satisfied | 33% | 8% |
Most common improvements for Very/Somewhat satisfied (72%, n=257)
- No suggestions/satisfied (33%)
- Answer phone more quickly/less time on hold (21%)
- More people on staff (20%)
Most common improvements for Very/Somewhat dissatisfied (28%, n=100)
- Answer phone more quickly/less time on hold (37%)
- More people on staff/phones (31%)
- More knowledgeable staff (21%)
- Staff should respond more quickly (19%)
Selected verbatims for Very/Somewhat satisfied (72%)
- “With better response times - not having to wait too long on hold or wait too long for an email response.”
- “Should hire more people.”
- “Shorter wait times calling and more staff.”
- “Quicker response times for online requests.”
- “Leisure guide lines too busy and activities fill up too quickly. Long waits for service and then the transfer to multiple people where you have to state your concern or question over and over.”
Selected verbatims for Very/Somewhat dissatisfied (28%)
- “The waiting time is too much. They should have more people for the services they have.”
- “The City needs to properly train staff.”
- “Quicker response time do a better job at tasks.”
- “Overall empathy towards its residents. More promptness when dealing with citizens' requests. The City should be more user friendly when contacting the City -- less wait time on the phones -- don't get passed around from employee to employee to get voicemail. The difficulty of getting and receiving information from the City, improve the communication on this.”
- “More staff.”
- “Longer hours.”
- “Hiring more staff. Everything takes too long but it is not the staff's fault.”
- “Actually following through with things they say they’re going to do.”
City Services
Overall Satisfaction with City Services
The majority (80%) of Winnipeggers are at least somewhat satisfied with city services.
Question 52 -- In general, how satisfied are you overall with the services provided by the City of Winnipeg? (Base: All respondents (excluding Don’t know/Refused). 2023 n=594)
| Year | Net very/ somewhat satisfied | Very satisfied | Somewhat satisfied | Somewhat dissatisfied | Very dissatisfied |
|---|---|---|---|---|---|
| 2019 | 87% | 17% | 71% | 10% | 1% |
| 2020 | 88% | 27% | 62% | 9% | 2% |
| 2021 | 90% | 23% | 64% | 10% | 3% |
| 2022 | 87% | 13% | 68% | 16% | 3% |
| 2023 | 80% | 12% | 68% | 16% | 4% |
Importance of Service Areas
Public safety is rated as the most important service area followed by infrastructure.
Question 53 -- Rank the following group of services in order of importance where 1 is the most important to you and 4 is the least important to you. (Base: All respondents (excluding Don’t know/Refused). 2023 n=560-586)
| Service Area | Importance (weighted) | % Ranked 1 and 2 | Ranking 2023 comparison to 2022 |
|---|---|---|---|
| Public Safety (Fire Paramedic, Police) | 1.6 | 84% | Increased since last year |
| Infrastructure (Roads, Water) | 2.3 | 64% | Stayed the same as last year |
| Community Services (Libraries, Recreation) | 2.8 | 37% | Decreased since last year |
| Property & Development (Land use planning) | 3.3 | 17% | Decreased since last year |
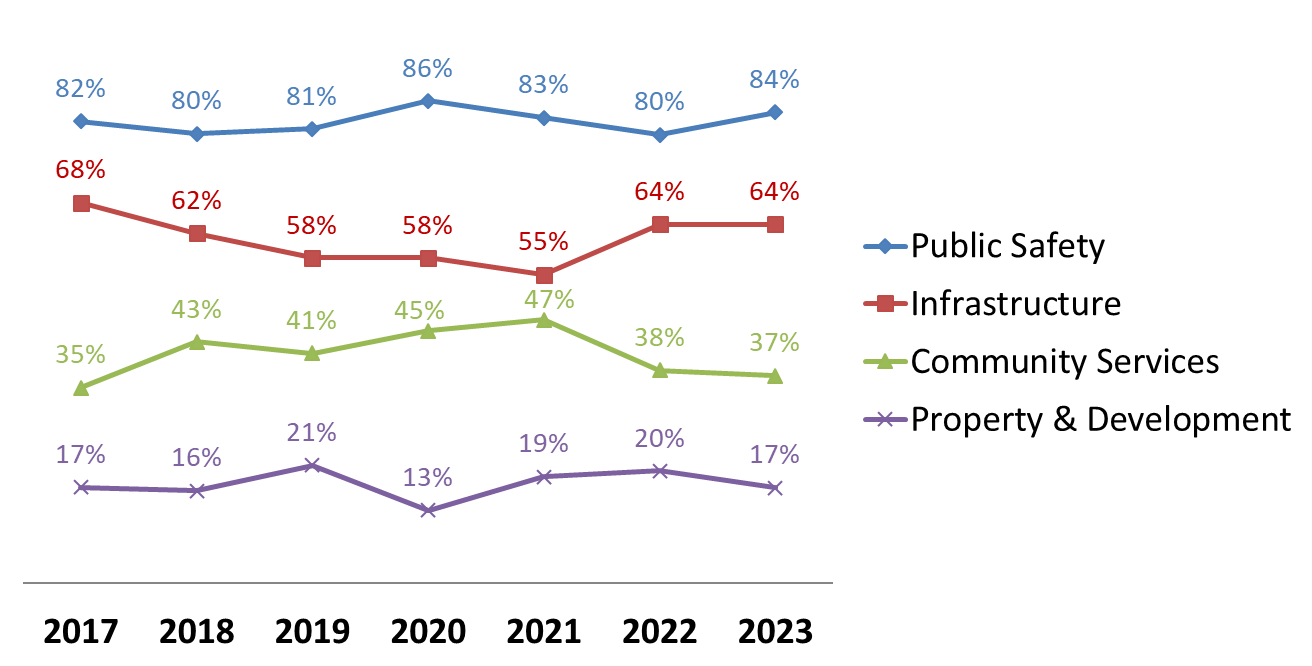
Chart showing how four service areas have changed in ranking since 2017. Throughout this time, public safety has remained as the top priority, infrastructure has remained as the second priority, community services has remained the third priority, and property and development has remained the fourth priority. From 2019 to 2021, community services rose and infrastructure dropped so they were nearly equally ranked with in 2021. In 2022 and 2023, infrastructure returned to being ranked 1 or 2 by 64% of the population and community services went back down to being ranked 1 or 2 by 37% of the population.
Satisfaction with Public Works
Question 15/Question 21/Question 22/Question 23/Question 27/Question 36/Question 41/ Question 42 -- Now, I'm going to read you a list of services that are provided by the City of Winnipeg. Please tell me whether you are very dissatisfied, somewhat dissatisfied, somewhat satisfied or very satisfied with each of the following services. (excluding Don’t know/Refused). 2023 n=461-593)
Condition of major parks (among those who used it)
| Year | Percent who responded very satisfied/somewhat satisfied |
|---|---|
| 2019 | 97% |
| 2020 | 97% |
| 2021 | 90% |
| 2022 | 90% |
| 2023 | 88% |
Note: in 2023, 56% of those who identified as Caucasian were very satisfied with the condition of major parks (higher than average).
Insect control
| Year | Percent who responded very satisfied/somewhat satisfied |
|---|---|
| 2019 | 88% |
| 2020 | 87% |
| 2021 | 86% |
| 2022 | 84% |
| 2023 | 81% |
Condition of the local park in your neighbourhood (among those who used it)
| Year | Percent who responded very satisfied/somewhat satisfied |
|---|---|
| 2019 | 88% |
| 2020 | 92% |
| 2021 | 82% |
| 2022 | 79% |
| 2023 | 80% |
Snow removal
| Year | Percent who responded very satisfied/somewhat satisfied |
|---|---|
| 2019 | 76% |
| 2020 | 77% |
| 2021 | 75% |
| 2022 | 63% |
| 2023 | 66% |
Management of rush hour traffic flow
| Year | Percent who responded very satisfied/somewhat satisfied |
|---|---|
| 2019 | 56% |
| 2020 | 60% |
| 2021 | 62% |
| 2022 | 56% |
| 2023 | 54% |
Note: In 2023, 35% of those with high school or less education were very satisfied with management of rush hour traffic flow (higher than average).
City’s efforts to keep city clean and beautiful
| Year | Percent who responded very satisfied/somewhat satisfied |
|---|---|
| 2019 | 76% |
| 2020 | 73% |
| 2021 | 65% |
| 2022 | 55% |
| 2023 | 58% |
Condition of major streets
| Year | Percent who responded very satisfied/somewhat satisfied |
|---|---|
| 2019 | 59% |
| 2020 | 58% |
| 2021 | 61% |
| 2022 | 41% |
| 2023 | 44% |
Note: In 2023, 56% of those who high school or less education were very satisfied with the condition of major streets (higher than average).
Condition of residential streets in your neighbourhood
| Year | Percent who responded very satisfied/somewhat satisfied |
|---|---|
| 2019 | 55% |
| 2020 | 54% |
| 2021 | 51% |
| 2022 | 39% |
| 2023 | 47% |
Satisfaction with Community Services
Question 35/ Question 37/ Question 38/ Question 39/ Question 40/ Question 49/ Question 51 -- Now, I'm going to read you a list of services that are provided by the City of Winnipeg. Please tell me whether you are very dissatisfied, somewhat dissatisfied, somewhat satisfied or very satisfied with each of the following services. (excluding Don’t know/Refused). 2023 n=168-549)
Public Library Services (among those who used it)
| Year | Percent who responded very satisfied/somewhat satisfied |
|---|---|
| 2019 | 94% |
| 2020 | 91% |
| 2021 | 93% |
| 2022 | 85% |
| 2023 | 84% |
Support for arts, entertainment & culture
| Year | Percent who responded very satisfied/somewhat satisfied |
|---|---|
| 2019 | 94% |
| 2020 | 85% |
| 2021 | 82% |
| 2022 | 82% |
| 2023 | 83% |
Community Centre operated programs (among those who used it)
| Year | Percent who responded very satisfied/somewhat satisfied |
|---|---|
| 2019 | 90% |
| 2020 | 94% |
| 2021 | 89% |
| 2022 | 89% |
| 2023 | 81% |
Condition of City of Winnipeg Community Centres (among those who used it)
| Year | Percent who responded very satisfied/somewhat satisfied |
|---|---|
| 2019 | 92% |
| 2020 | 85% |
| 2021 | 75% |
| 2022 | 79% |
| 2023 | 75% |
Condition of City-operated recreation facilities (among those who used it)
| Year | Percent who responded very satisfied/somewhat satisfied |
|---|---|
| 2019 | 90% |
| 2020 | 85% |
| 2021 | 75% |
| 2022 | 76% |
| 2023 | 70% |
Efforts to ensure that residential property standards are met through inspections
| Year | Percent who responded very satisfied/somewhat satisfied |
|---|---|
| 2019 | 68% |
| 2020 | 70% |
| 2021 | 72% |
| 2022 | 66% |
| 2023 | 68% |
City-operated recreation programs (among those who used it)
| Year | Percent who responded very satisfied/somewhat satisfied |
|---|---|
| 2019 | 91% |
| 2020 | 87% |
| 2021 | 83% |
| 2022 | 86% |
| 2023 | 67% |
Note: There are no demographic subgroups more likely to be satisfied with community services.
Satisfaction with Police Service
Question 24/ Question 25/ Question 46 -- Now, I'm going to read you a list of services that are provided by the City of Winnipeg. Please tell me whether you are very dissatisfied, somewhat dissatisfied, somewhat satisfied or very satisfied with each of the following services. (excluding Don’t know/Refused). 2023 n=128-562)
Enforcement of traffic laws
| Year | Percent who responded very satisfied/somewhat satisfied |
|---|---|
| 2019 | 74% |
| 2020 | 72% |
| 2021 | 71% |
| 2022 | 68% |
| 2023 | 68% |
Police Service response to 911 calls (among those who used it)
| Year | Percent who responded very satisfied/somewhat satisfied |
|---|---|
| 2019 | 77% |
| 2020 | 78% |
| 2021 | 69% |
| 2022 | 63% |
| 2023 | 60% |
Police service efforts in crime prevention
| Year | Percent who responded very satisfied/somewhat satisfied |
|---|---|
| 2019 | 75% |
| 2020 | 74% |
| 2021 | 70% |
| 2022 | 70% |
| 2023 | 58% |
Satisfaction with Fire Paramedic Services
Question 17/ Question 28/ Question 44/ Question 47/ Question 48 -- Now, I'm going to read you a list of services that are provided by the City of Winnipeg. Please tell me whether you are very dissatisfied, somewhat dissatisfied, somewhat satisfied or very satisfied with each of the following services. (excluding Don’t know/Refused). 2023 n=153-523)
Fire and rescue service response to fire emergencies
| Year | Percent who responded very satisfied/somewhat satisfied |
|---|---|
| 2019 | 98% |
| 2020 | 97% |
| 2021 | 93% |
| 2022 | 88% |
| 2023 | 88% |
Fire and injury prevention education
| Year | Percent who responded very satisfied/somewhat satisfied |
|---|---|
| 2019 | 88% |
| 2020 | 89% |
| 2021 | 85% |
| 2022 | 79% |
| 2023 | 82% |
Level of city preparedness, ability to respond, and assist during natural and human caused disasters
| Year | Percent who responded very satisfied/somewhat satisfied |
|---|---|
| 2019 | 89% |
| 2020 | 90% |
| 2021 | 81% |
| 2022 | 74% |
| 2023 | 79% |
Safety of existing buildings through fire inspections and enforcement
| Year | Percent who responded very satisfied/somewhat satisfied |
|---|---|
| 2019 | 91% |
| 2020 | 89% |
| 2021 | 85% |
| 2022 | 81% |
| 2023 | 75% |
Note: In 2023, 80% of people from the Outer city were very or somewhat satisfied and 82% of men were very or somewhat satisfied with the safety of existing buildings through fire inspections and enforcement (higher than average).
Emergency response capability for medical emergencies
| Year | Percent who responded very satisfied/somewhat satisfied |
|---|---|
| 2019 | 88% |
| 2020 | 87% |
| 2021 | 84% |
| 2022 | 74% |
| 2023 | 70% |
Satisfaction with Planning, Property & Development
Question 16/ Question 18/ Question 19/ Question 20/ Question 29/ Question 45 -- Now, I'm going to read you a list of services that are provided by the City of Winnipeg. Please tell me whether you are very dissatisfied, somewhat dissatisfied, somewhat satisfied or very satisfied with each of the following services. (excluding Don’t know/Refused). 2023 n=449-527)
Efforts in preserving heritage buildings
| Year | Percent who responded very satisfied/somewhat satisfied |
|---|---|
| 2019 | 91% |
| 2020 | 84% |
| 2021 | 81% |
| 2022 | 77% |
| 2023 | 76% |
Efforts in promoting economic development
| Year | Percent who responded very satisfied/somewhat satisfied |
|---|---|
| 2019 | 80% |
| 2020 | 77% |
| 2021 | 72% |
| 2022 | 67% |
| 2023 | 67% |
Community planning to guide growth and change
| Year | Percent who responded very satisfied/somewhat satisfied |
|---|---|
| 2019 | 77% |
| 2020 | 66% |
| 2021 | 66% |
| 2022 | 64% |
| 2023 | 62% |
Zoning regulations and building permits
| Year | Percent who responded very satisfied/somewhat satisfied |
|---|---|
| 2019 | 74% |
| 2020 | 66% |
| 2021 | 62% |
| 2022 | 60% |
| 2023 | 62% |
Funding for improving inner city housing
| Year | Percent who responded very satisfied/somewhat satisfied |
|---|---|
| 2019 | 61% |
| 2020 | 60% |
| 2021 | 53% |
| 2022 | 49% |
| 2023 | 49% |
Note: In 2023, 68% of those who identified as a visible minority were very or somewhat satisfied with funding for improving inner city housing (higher than average).
Downtown renewal
| Year | Percent who responded very satisfied/somewhat satisfied |
|---|---|
| 2019 | 74% |
| 2020 | 68% |
| 2021 | 59% |
| 2022 | 54% |
| 2023 | 47% |
Satisfaction with Water and Waste
Question 30 to Question 34 -- Now, I'm going to read you a list of services that are provided by the City of Winnipeg. Please tell me whether you are very dissatisfied, somewhat dissatisfied, somewhat satisfied or very satisfied with each of the following services. (excluding Don’t know/Refused). 2023 n=505-593)
Protection from river flooding
| Year | Percent who responded very satisfied/somewhat satisfied |
|---|---|
| 2019 | 96% |
| 2020 | 93% |
| 2021 | 90% |
| 2022 | 80% |
| 2023 | 89% |
Garbage collection
| Year | Percent who responded very satisfied/somewhat satisfied |
|---|---|
| 2019 | 94% |
| 2020 | 94% |
| 2021 | 90% |
| 2022 | 84% |
| 2023 | 87% |
The Recycling Program
| Year | Percent who responded very satisfied/somewhat satisfied |
|---|---|
| 2019 | 83% |
| 2020 | 88% |
| 2021 | 84% |
| 2022 | 78% |
| 2023 | 82% |
Note: In 2023, 88% of men were very or somewhat satisfied with the recycling program (higher than average).
Protection from sewer back-up
| Year | Percent who responded very satisfied/somewhat satisfied |
|---|---|
| 2019 | 85% |
| 2020 | 88% |
| 2021 | 86% |
| 2022 | 76% |
| 2023 | 82% |
Quality of the drinking water
| Year | Percent who responded very satisfied/somewhat satisfied |
|---|---|
| 2019 | 85% |
| 2020 | 86% |
| 2021 | 84% |
| 2022 | 81% |
| 2023 | 81% |
Note: In 2023, 55% of those who identified as Caucasian were very satisfied with the quality of the drinking water (higher than average).
Satisfaction with Transit / SOAs
Question 26/Question 43/Question 50 -- Now, I'm going to read you a list of services that are provided by the City of Winnipeg. Please tell me whether you are very dissatisfied, somewhat dissatisfied, somewhat satisfied or very satisfied with each of the following services. (excluding Don’t know/Refused). 2023 n=138-563)
Animal services
| Year | Percent who responded very satisfied/somewhat satisfied |
|---|---|
| 2019 | 93% |
| 2020 | 91% |
| 2021 | 85% |
| 2022 | 84% |
| 2023 | 81% |
Availability and convenience of on-street parking
| Year | Percent who responded very satisfied/somewhat satisfied |
|---|---|
| 2019 | 62% |
| 2020 | 58% |
| 2021 | 66% |
| 2022 | 56% |
| 2023 | 59% |
Public transit (among those who used it)
| Year | Percent who responded very satisfied/somewhat satisfied |
|---|---|
| 2019 | 69% |
| 2020 | 59% |
| 2021 | 69% |
| 2022 | 68% |
| 2023 | 55% |
Use of City Services
Visited a local neighbourhood park
Question 58 -- Have you visited your local neighbourhood park in the past year? (excluding Don’t know/Refused). 2023 n=597)
| Year | Percent who used in the past year |
|---|---|
| 2019 | 89% |
| 2020 | 83% |
| 2021 | 83% |
| 2022 | 83% |
| 2023 | 87% |
Visited a major park
Question 59 -- Have you visited a major park like Kildonan Park or St. Vital Park in the past year? (excluding Don’t know/Refused). 2023 n=599)
| Year | Percent who responded very satisfied/somewhat satisfied |
|---|---|
| 2019 | 85% |
| 2020 | 76% |
| 2021 | 71% |
| 2022 | 79% |
| 2023 | 79% |
Note: in 2023, 52% of those with less than high school education visited a major park in the last year and 64% of those who have a household income less than $30,000 visited a major park in the last year (lower than average).
Used the services of the City's public libraries
Question 64 -- Have you or someone in your family used the services of the City's public libraries in the past year? (excluding Don’t know/Refused). 2023 n=593)
| Year | Percent who responded very satisfied/somewhat satisfied |
|---|---|
| 2019 | 70% |
| 2020 | 67% |
| 2021 | 52% |
| 2022 | 54% |
| 2023 | 57% |
Note: in 2023, 18% of those with less than high school education used the services of the City’s public libraries (lower than average).
Attended a local Community Centre Facility
Question 55 -- Have you attended your local Community Centre Facility in the past year? (excluding Don’t know/Refused). 2023 n=598)
| Year | Percent who responded very satisfied/somewhat satisfied |
|---|---|
| 2019 | 51% |
| 2020 | 54% |
| 2021 | 28% |
| 2022 | 36% |
| 2023 | 49% |
Note: in 2023, 36% of those who were 55 years or older attended a local Community Centre Facility in the past year (lower than average).
Visited a City Recreational Facility
Question 54 -- Have you visited a City Recreational Facility like a pool or leisure centre in the past year? (excluding Don’t know/Refused). 2023 n=599)
| Year | Percent who responded very satisfied/somewhat satisfied |
|---|---|
| 2019 | 62% |
| 2020 | 54% |
| 2021 | 27% |
| 2022 | 34% |
| 2023 | 48% |
Participated in a City Recreational Program
Question 56 -- Have you or someone in your family participated in a City Recreational Program like swimming lessons, Learn to Skate or other Leisure Guide Programs in the past year? (excluding Don’t know/Refused). 2023 n=594)
| Year | Percent who responded very satisfied/somewhat satisfied |
|---|---|
| 2019 | 42% |
| 2020 | 42% |
| 2021 | 24% |
| 2022 | 27% |
| 2023 | 34% |
Participated in a Community Centre Program
Question 57 -- Have you or your family participated in a Community Centre Program like hockey or soccer in the past year? (excluding Don’t know/Refused). 2023 n=596
| Year | Percent who responded very satisfied/somewhat satisfied |
|---|---|
| 2019 | 29% |
| 2020 | 29% |
| 2021 | 23% |
| 2022 | 23% |
| 2023 | 31% |
Been involved in an emergency medical incident
Question 61 -- In the past year, have you or a family member been involved in an emergency medical incident where paramedics were requested? (excluding Don’t know/Refused). 2023 n=598
| Year | Percent who responded very satisfied/somewhat satisfied |
|---|---|
| 2019 | 22% |
| 2020 | 27% |
| 2021 | 24% |
| 2022 | 26% |
| 2023 | 26% |
Regularly use City Transit
Question 60 -- Do you regularly use the City Transit (e.g. seasonally or at least once a week)? (excluding Don’t know/Refused). 2023 n=599
| Year | Percent who responded very satisfied/somewhat satisfied |
|---|---|
| 2019 | 28% |
| 2020 | 29% |
| 2021 | 21% |
| 2022 | 20% |
| 2023 | 23% |
Note: In 2023, 38% of those who rent their home used City Transit and 42% of those who identified as Indigenous used City Transit (higher than average)
Been involved in an incident where a 911 call of police response was needed
Question 62 -- In the past year, have you personally used, or been involved in an incident where a 911 call for police response was needed? (excluding Don’t know/Refused). 2023 n=600
| Year | Percent who responded very satisfied/somewhat satisfied |
|---|---|
| 2019 | 18% |
| 2020 | 21% |
| 2021 | 18% |
| 2022 | 20% |
| 2023 | 23% |
Applied for a building permit
Question 63 -- Have you applied for a building permit in the past year? (excluding Don’t know/Refused). 2023 n=599
| Year | Percent who responded very satisfied/somewhat satisfied |
|---|---|
| 2019 | 6% |
| 2020 | 4% |
| 2021 | 6% |
| 2022 | 8% |
| 2023 | 8% |
Key Findings
Quality of Life Indicators
- The majority of Winnipeggers (84%) rate the overall quality of life in the City as very good or good. This has dropped for the third consecutive year, and dropped from 88% in 2022.
- Most quality of life indicators are down from 2022, with noticeable declines in feeling safe walking alone at night in neighbourhood (60% - down 6%), easy to get around by bicycle (58% - down 5%), and easy to get around by transit (56% - down 5%).
- The most common actions cited to improve the quality of life in Winnipeg are related to roads/infrastructure (36%), followed by crime and policing (33%) and housing/social programs (30%). Compared to 2022, the biggest changes were in roads/infrastructure (down from 58% to 36%) and crime and policing (up from 14% to 33%).
Net Promoter Score
- Around one in five citizens (21%) are promoters of the City of Winnipeg, but the overall 2023 Net Promoter Score sits at -15, which is similar to 2022 (-14) but still much lower than 2021 (+1).
Value for Tax Dollars
- 59% of citizens feel that they receive good or very good value for their property tax dollars. This is unchanged from 2022 (59%) and ties for the lowest rating over the past five years.
- The most common reasons for finding good value for property tax dollars are general satisfaction with the city (36%), satisfaction with snow clearing (16%), satisfaction with garbage and recycling (14%) and satisfaction with roads (10%).
- The most common reasons finding poor value for property tax dollars are dissatisfaction with roads (39%), dissatisfaction with city spending (16%), dissatisfaction with city services (14%), and dissatisfaction with taxes (13%).
Customer Service
- 60% of Winnipeggers contacted the City in the past year, most commonly by phone (84%). The proportion who contacted the City by phone has been fairly stable, but those contacting by email (22%) and online (15%) are the highest over the past five years.
- Satisfaction with customer service is somewhat high at 72%, but is the lowest over the past five years (down only slightly from 73% in 2022). Satisfaction is similar whether contact is by email (73%), online (72%) or phone (71%)
- The majority of Winnipeggers (87%) agree that city staff are courteous, helpful, and knowledgeable, while fewer (52%) agree that City staff are easy to get a hold of when they need them. Ratings of areas of customer service are similar to 2022, but much lower than 2019 to 2021.
City Services
- Overall satisfaction with city services is 80%, but is the lowest proportion in past five years, which ranged from 87% to 90%.
- Public Safety remains the most important service area among four tested, ahead of infrastructure.
- Satisfaction with city services remains high for the majority of services; however, some services saw a decrease in satisfaction from 2022 by more than 10%.
- City-operated recreational programs (67% - down 19%)
- Public transport (55% - down 13%)
- Police service efforts in crime prevention (58% - down 12%)
- Four individual city services received almost 90% satisfaction ratings:
- Protection from rive flooding (89% - up 9%)
- Condition of major parks (88% - down 2%)
- Fire and rescue service response to fire emergencies (88% - no change)
- Garbage collection (87% - up 3%)
- Individual city services that received under 50% satisfaction ratings:
- Funding for improving inner city housing (49% - no change)
- Condition of residential streets in your neighbourhood (47% - up 8%)
- Condition of major streets (44% - up 3%)