Photo enforcement is part of the Winnipeg Police Service's overall strategy to make the city streets safe for drivers, pedestrians and cyclists alike.
As speeding is of particular concern in areas where our most vulnerable persons are, the Winnipeg Police Service has assigned ten mobile units to conduct speed enforcement in School Zones, Playground Zones and Construction Zones. The enforced areas must be identified by provincially approved School, Playground and Construction Zone signs respectively."
Additionally, there are 49 intersection safety cameras in place across Winnipeg.
Our message is simple: Just Slow Down.
The Service wants to remind drivers that collisions are not accidents.
If it’s predictable, it’s preventable.
If you have any questions please e-mail us.
Intersection Safety Cameras capture, through digital imaging, drivers who violate red lights and speed through intersections. The goal is to reduce the amount of red light running that occurs on Winnipeg streets, and they are also an effective tool for reducing the speeds of vehicles in these intersections.
Signs for intersection safety camera enforcement are posted at every intersection where an intersection safety camera is installed, informing motorists that cameras are in use at these locations. Signs are located at major entrances into Winnipeg to remind motorists that intersections may be photo enforced.
The intersection safety camera is usually located about 20 metres back from the intersection. This allows photographs to be taken of the rear of the vehicle that is violating the red light or travelling at a high rate of speed. The camera is connected to the traffic signal control box and to two sensors buried in the roadway. One sensor is installed near the stop line, and the second sensor is about two meters back from the first.
When the light turns red, the sensors become active. A vehicle traveling over the sensor triggers the camera unit and two photographs are taken.
- The first picture is of the vehicle outside the intersection during the red phase. The picture shows that the traffic light is red.
- The second picture shows the vehicle actually in the intersection and must show that the light is still red for an offence to have been committed.
Violations occur when:
- a vehicle behind the stop line when the light turns red proceeds through the intersection.
- drivers fail to stop before turning right on a red light.
- drivers exceed the posted speed limit
Photo enforcement is part of the Winnipeg Police Service's overall strategy to make the city streets safe for drivers, pedestrians and cyclists alike. Mobile vehicles equipped with radar or lidar rapid-action cameras and enforcement equipment take photographs of vehicles violating Winnipeg's speed limits.
If an offender speeds past a photo enforcement equipped vehicle, it triggers the camera to take a picture of only the speeding vehicle and license plate as observed by the enforcement officer in the vehicle. These pictures, along with a traffic violation notice, are mailed to the registered owner of the speeding vehicle.
Photo enforcement is slightly different from conventional enforcement. The photo enforcement beam width is much narrower and aimed across the roadway. This method is more vehicle-specific. If more than one vehicle is in the beam, the system does not take a photograph
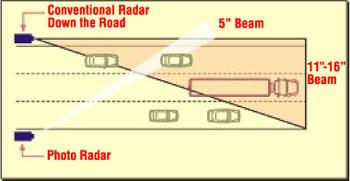
The diagram above shows the difference in beam coverage between conventional enforcement that is shot down the road and photo enforcement utilizing radar that is shot across the road. As illustrated, the width of the conventional beam is quite large and may have several vehicles in the beam, which requires operator interpretation of the violation. With photo enforcement, the beam coverage is more vehicle-specific and eliminates the need for interpretation. With photo enforcement if more than one vehicle is in the beam the unit does not send the command to the camera to take a violation photo.
Lidar equipment, commonly referred to as laser, utilizes a much narrower beam of light that is cast down the road and is capable of targeting specific vehicles. In other words, it is target specific. In both instances, only vehicles that are receding and are in violation are targeted.
| Month | Tickets Issued | Year to Date Total |
|---|---|---|
| January 1 - March 31, 2024 | 18,391 | 18,391 |
| April 1 - June 30, 2024 | ||
| July 1 - September 30, 2024 | ||
| October 1 - December 21, 2024 |
Mobile Photo Radar/Laser total tickets issued in previous years
| 2023 | 2022 | 2021 |
|---|---|---|
| 80,424 | 72,940 | 90,907 |
| Month | Tickets Issued | Year to Date Total |
|---|---|---|
| January 1 - March 31, 2024 | 6,552 | 6,552 |
| April 1 - June 30, 2024 | ||
| July 1 - September 30, 2024 | ||
| October 1 - December 21, 2024 |
Intersection safety camera offences total tickets issued in previous years
| 2023 | 2022 | 2021 |
|---|---|---|
| 38,465 | 37,925 | 36,309 |
Click on a month to see the breakdown by district of red light offences; speeding offences; highest speed rates recorded; total offence notices issued; and year to date totals.
2024
2023
- January 1 - March 31 (PDF, 25KB)
- April 1 - June 30 (PDF, 30KB)
- July 1 - September 30 (PDF, 29KB)
- October 1 - December 31 (PDF, 29KB)
2022
Contact or attend the Provincial Offences Court at 373 Broadway in Winnipeg (telephone: 204-945-3156) or any Regional Provincial Court Office. All Provincial Court Offices are open Monday to Friday between 8:30 a.m. and 4:30 p.m. (excluding holidays).Further information on tickets.
Under the Provincial Offences Act, Section 13 (2) A photo enforcement ticket may be served on the owner of the vehicle by sending it by regular mail to the owner's last known address as indicated in the records of the Registrar of Motor Vehicles within 14 days after the date of the alleged offence. The ticket is deemed to have been served seven days after the day it was mailed.
Any speed over the posted speed limit is considered speeding.
Intersection Safety Camera (ISC) enforcement is lane specific. The system identifies the violating vehicle in the specific lane traveling over electromagnetic in-ground loops in the roadway.
Regarding Mobilephoto enforcement Enforcement, a trained and qualified Enforcement Officer has observed the vehicle in violation and has made notes accordingly.
To view your violation details and digital color photo images, follow the instructions on the bottom left of your photo enforcement Ticket. You can also contact or attend the Provincial Offences Court at 373 Broadway in Winnipeg (telephone: 204-945-3156), or any Regional Provincial Offences Court. All Provincial Offences Courts are open Monday to Friday between 8:30 a.m. and 4:30 p.m. (excluding holidays).
No. Two photographs are taken by the intersection safety camera of violations that occur at the enforced locations. One photograph of the vehicle in violation is taken by the mobilephoto enforcement system.Image Capturing Enforcement Regulation 220/2002 of the Manitoba Highway Traffic Act.
No. Provincial legislation requires the ticket to be issued to the registered owner of the Manitoba vehicle number plate on the violating vehicle. The registered owner information is on file with the Manitoba Public Insurance, Registrar of Motor Vehicles. The registered owner is the person summoned and therefore responsible for responding by the due date noted, as explained on the front and back of the ticket. There is an option on the back of the ticket where the registered owner can authorize another person to respond on their behalf however the registered owner remains responsible.
No. Provincial legislation requires that the ticket be mailed to the address of the registered owner on file with Manitoba Public Insurance, Registrar of Motor Vehicles.
The systems are approved by the Government of Manitoba Minister of Justice. The systems are tested regularly. For more information on the Image Capturing Enforcement Regulation 220/2002 of the Manitoba Highway Traffic Act.
The City of Winnipeg Public Works Department, Transportation Division is responsible for posting signage.